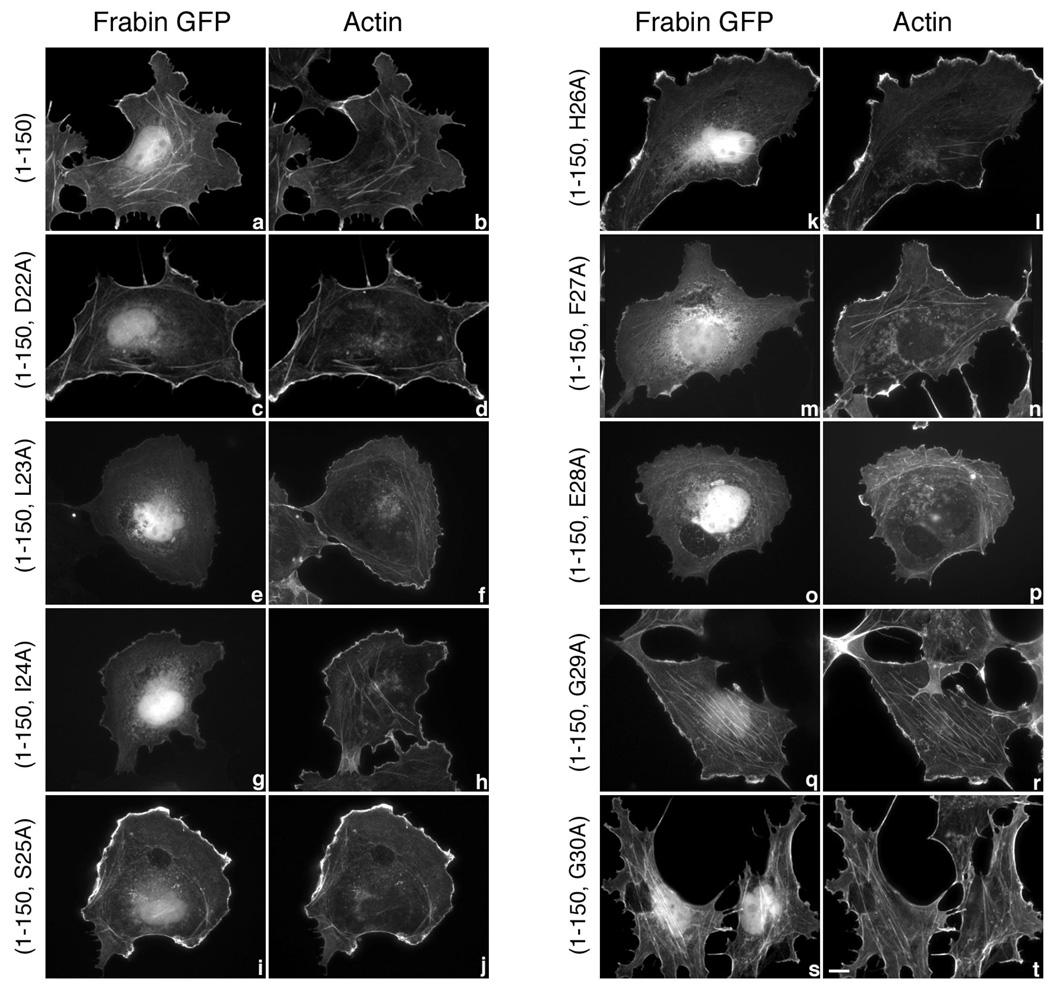
Figure 3. Subcellular localization of frabin mutants.
COS-7 cells were transiently transfected with 1 µg expression vectors encoding GFP-tagged frabin mutants, frabin(1–150) (a and b), frabin(1–150, D22A) (c and d), frabin(1–150, L23A) (e and f), frabin(1–150, I24A) (g and h), frabin(1–150, S25A) (i and j), frabin(1–150, H26A) (k and l), frabin(1–150, F27A) (m and n), frabin(1–150, E28A) (o and p), frabin(1–150, G29A) (q and r) and frabin(1–150, G30A) (s and t). Expressed proteins were visualized by GFP fluorescence (a, c, e, g, I, k, m, o, q and s), and actin was visualized (b, d, f, h, j, l, n, p, r and t) in the same cells by staining with Alexa 594 conjugated to phalloidin. Bar, 10 µm. Images shown are single cells representative of at least five separate experiments in which more than fifty cells were viewed in each experiment. Note that frabin(1–150) (a) and unaffected frabin(1–150) mutants (c, i, k, q, s) show an intense GFP signal at the cell periphery and at intracellular stress fibers that co-localizes with F-actin, whereas L23A, I24A, F27A, and E28A frabin(1–150) (e, g, m, o) reproducibly display a weak GFP signal at the cell periphery. The weak signal at the cell periphery observed with the four frabin mutants (e, g, m, o) is identical to the background signal of GFP alone.

