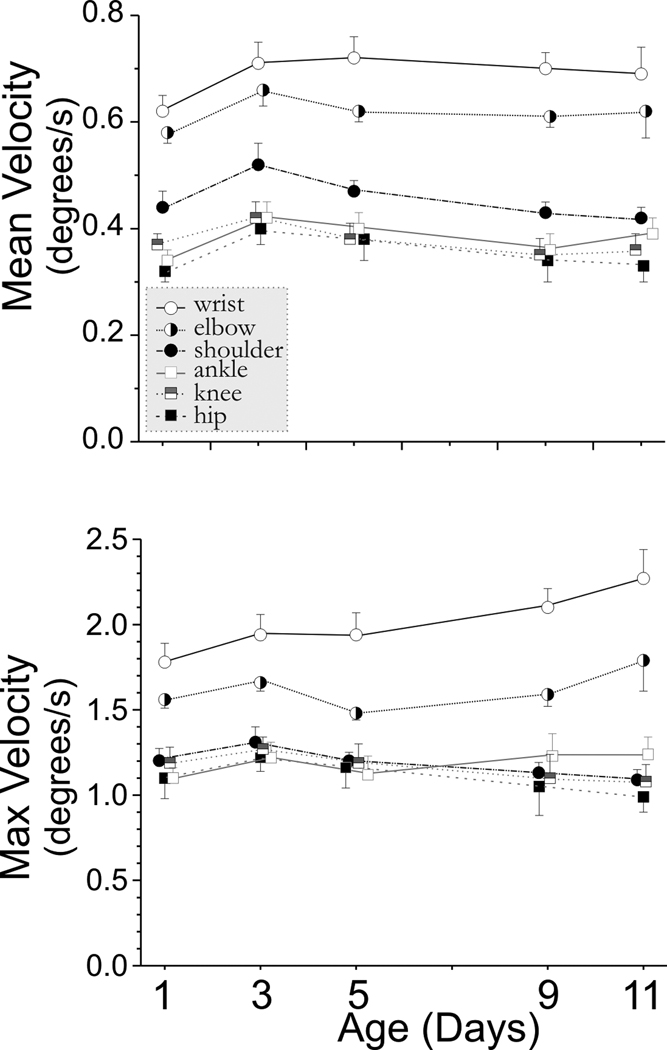
Figure 3. Angular velocity in Control Animals from P1–P11.
Rabbit kit joint motion during swimming was video taped on day 1,3,5,9 and 11 of life (n=14 control kits). Joint position and angles were calculated from 80–100 frames of digitized video. A Matlab program was used to calculate the range, mean, minimum and maximum angular velocity (degrees/sec) for the 3 major joints in the fore (wrist, elbow, shoulder) and hind limbs (ankle, knee, hip). This figure shows the mean± SEM for the mean and maximum angular velocity. The forelimb is represented by circles and the hindlimb by squares. Some of the symbols have been offset slightly at each time point for clarity.

