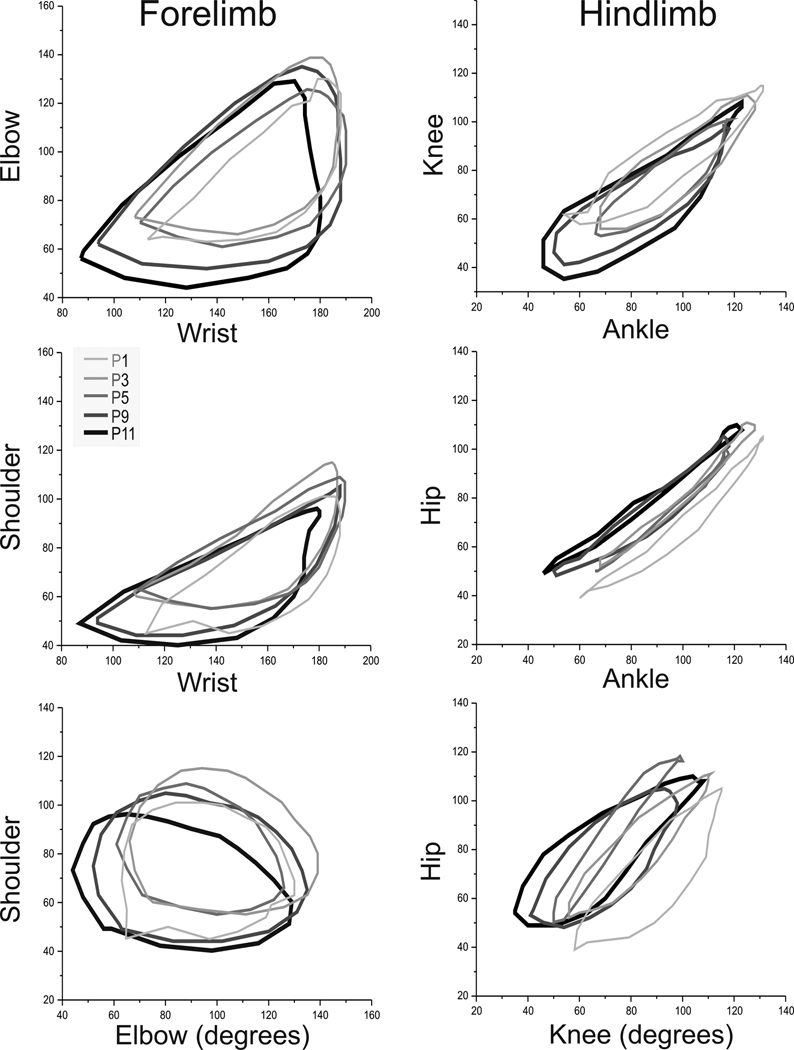
Figure 4. Two joint plots of control rabbit kits from P1–P11.
Rabbit kit joint motion during swimming was video taped on day 1,3,5,9 and 11 of life (n=14 control kits). The 80–100 frames of digitized swimming video were used to plot the angles of joints in the fore- and hind limbs and then mean angles obtained for each animal. Only mean values are shown for clarity for each pair of joints on day 1,3,5,9 and 11 (3 pairs each for fore- and hind limb).
P1 Light gray thin line, P3 Dark-light gray and thicker line, P5 Dark gray, P9 Dark-dark gray, P11 Black and thick line.
Panel A Wrist-Elbow, Panel B Wrist-Shoulder Panel C Elbow-Shoulder, Panel D Ankle-Knee, Panel E Ankle Hip and Panel F Knee-Hip.
There is a maturational shift to lesser angles in all joints except the hip with increasing age from P1 to P11.

