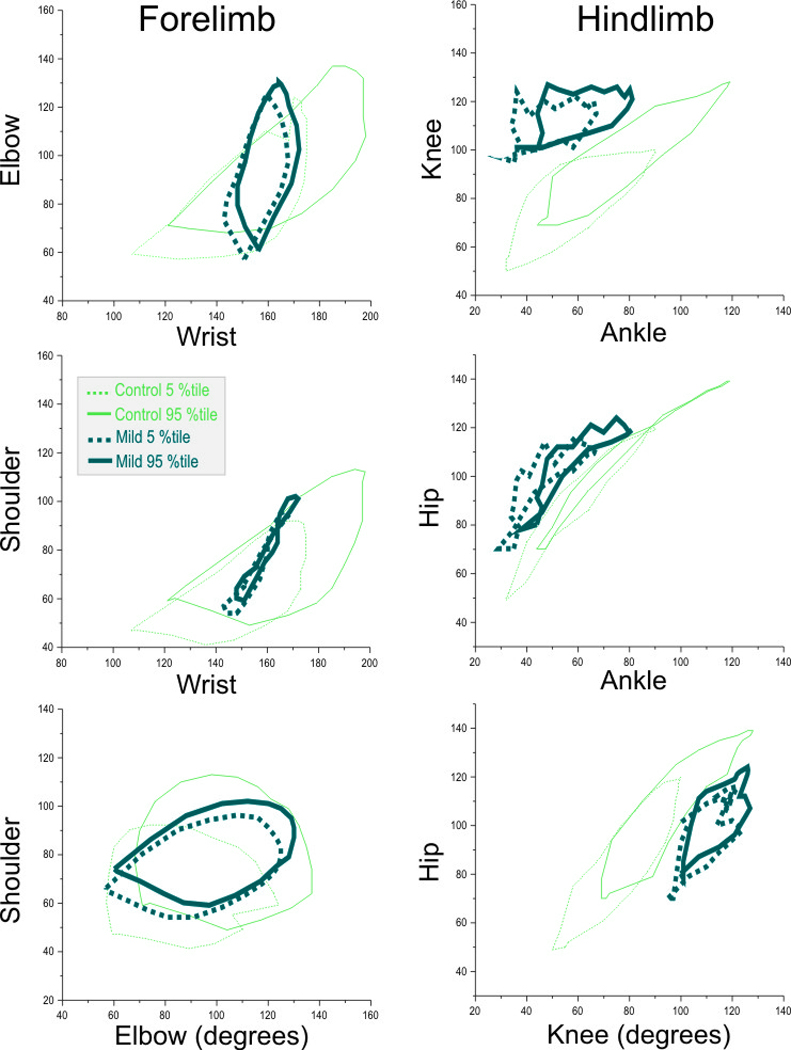
Figure 6. Two joint plots of control and mild group at P1.

Plots of the 3 pairs of joints in the fore- and hind limbs of P1 kits in the control and mildly affected group (n=18 control, n=9 mild group). The plots depict the 5th and 95th percentiles. Panel A Wrist-Elbow, Panel B Wrist-Shoulder Panel C Elbow-Shoulder, Panel D Ankle-Knee, Panel E Ankle Hip and Panel F Knee-Hip. Using the two-joint analysis, one can easily identify the mildly affected kits. In the forelimb, the wrist is predominantly affected and thus Panels A and B are useful in identifying the mild group, while in the hind limb, there are deficits in all joints and thus all Panels D–F show clear cut differences.
