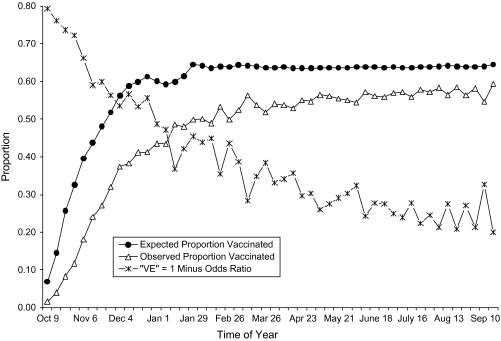
Figure 5.
Observed and expected proportions of decedents with influenza vaccination and the corresponding bias in vaccine effectiveness (VE), Kaiser Permanente, Northern California, 1996–2005. Deaths occurring during the 9 influenza seasons were omitted, so “VE” reflects bias rather than effectiveness.

