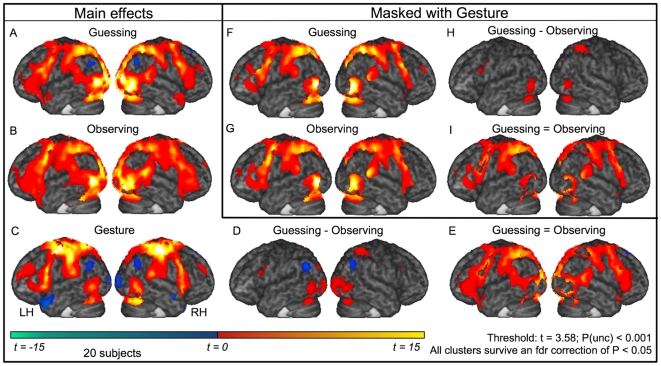
Figure 1. Activation maps rendered on mean anatomy.
Activation maps rendered on the mean anatomy of all 20 subjects. (A–D) Main effects guessing-baseline, passive observation-baseline, gesture-baseline, guessing-passive observation. (E) Areas similarly activated during guessing and passive observation (i.e. guessing-baseline p<0.001 & passive observation-baseline p<0.001 & guessing-passive observation p>0.001). (F–I) A, B, D and E, each masked inclusively with C. All images are thresholded at t = 3.58 which corresponds to an uncorrected p≤0.001. All voxels also survive false discovery rate (fdr) correction p<0.05.

