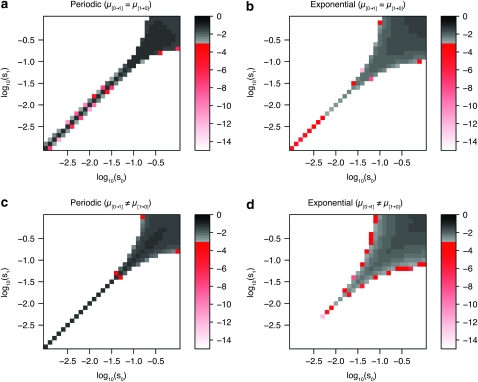
Figure 2.—
Evolution of stochastic switching rates in asymmetric fitness landscapes. The plot shows the log10 of the evolutionarily stable switching rates. In c and d, the smaller of the two rates (μ[0→1] and μ[1→0]) is shown. The threshold phenomenon is clearly visible as a sudden drop from switching rates at high levels (shown by the gray color gradient) to rates ≤10−15 (shown in white). Intermediate rates are almost nonexistent (shown by the red color gradient). (a–d) The periodic (a and c) and the exponential case (b and d). Each of the 900 points shows the average of 50 invasion trials. s0 and s1 vary from 0.001 to 1, and the mean waiting time is n = 20. In principle, the plots should be perfectly symmetric along the diagonal s0 = s1. The slight deviations from perfect symmetry are due to the stochastic nature of the simulations. The condition that the switching rates are equal in both directions is relaxed in c and d, where the two rates are allowed to evolve independently (i.e., μ[0→1] ≠ μ[1→0]). In c and d, only the lower of the two rates is shown.

