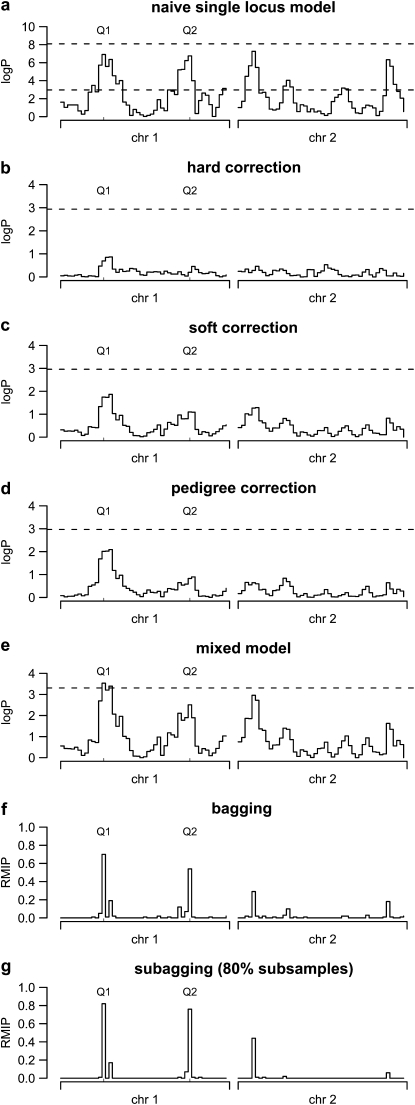
Figure 1.—
Single-locus and multilocus genome scans for a simulated F18 advanced intercross. (a–d) The single-locus HAPPY model applied to a simulated two-chromosome F18 population. (a) The single-locus model with permutation (bottom dashed line) and parametric bootstrap (top dashed line) thresholds. (b–d) The effect of correcting the phenotype for family, with dashed lines marking permutation thresholds. (e) The single-locus model including a sibship variance component with a threshold derived by parametric bootstrap. (f and g) Resample model inclusion probabilities (RMIPs) for each marker interval derived from bagging (f) and subagging (g). The positions of the two simulated QTL are marked Q1 and Q2.

