Figure 4.—
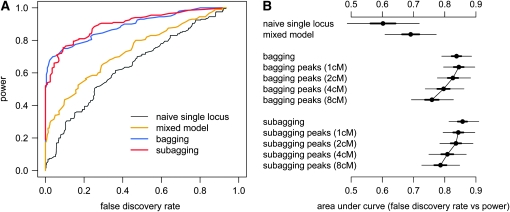
Performance of single- and multilocus methods in mapping two QTL in 100 simulated HS populations. (A) Plot of predictions at a range of cutoffs for the maximum log P in a segment (naive single-locus model, mixed model) or the range probability over a segment (subagging with 80% subsamples, bagging). Forward selection is represented as a single point. (B) Plot of the area under the curves in a, including results for variants of bagging and subagging in which model selection is applied to only a representative set of peaks, spaced a minimum distance apart (in parentheses), rather than to all loci. Area estimates are plotted with 50 and 95% confidence intervals (thick and thin horizontal bars; see Figure 2 legend for more details).

