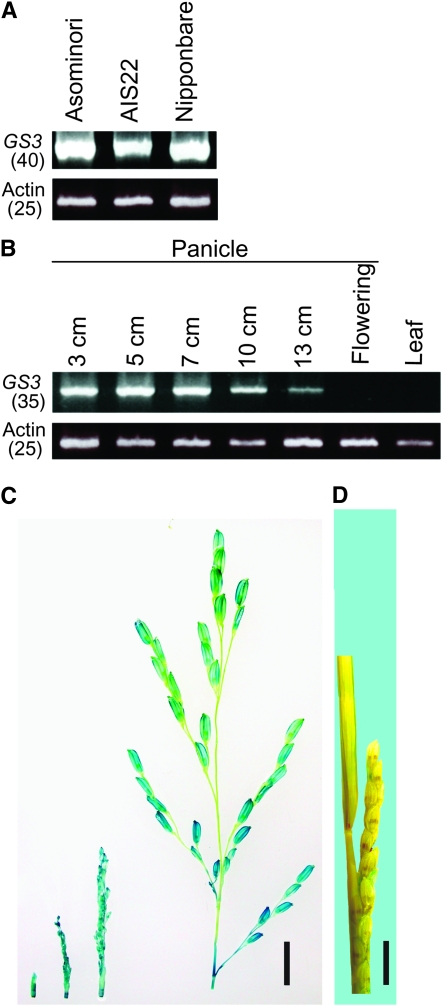
Figure 2.—
Expression analysis of GS3 using RT–PCR and genetic transformation. (A) RT–PCR of GS3 from Asominori, AIS22, and Nipponbare using young panicles (∼3 cm) for RNA extraction. Numbers in parentheses indicate cycles of PCR. Actin cDNA was amplified as a control. (B) RT–PCR of GS3 from Asominori using panicles ∼3, 5, 7, 10, and 13 cm and after heading and a flag leaf for RNA extraction. (C and D) GUS staining of transgenic plants transformed with the GS3 promotor:GUS fusion construct showing panicles before flowering (C) and a panicle at flowering with a flag leaf (D). Bars, 1 cm.

