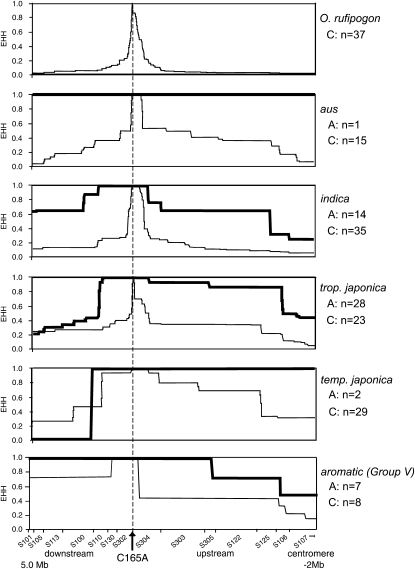
Figure 4.—
EHH across the GS3 genomic region for O. rufipogon and the five varietal groups of O. sativa. EHH values for individuals containing the C allele (short grain) or the A allele (long grain) at GS3 are indicated by thin or thick lines, respectively. The arrow indicates the relative position of the C165A mutation; S designations along the x-axis indicate primers (Table S1) used to detect polymorphisms; and tick marks along the x-axis indicate correspondence between polymorphisms and amplicons.

