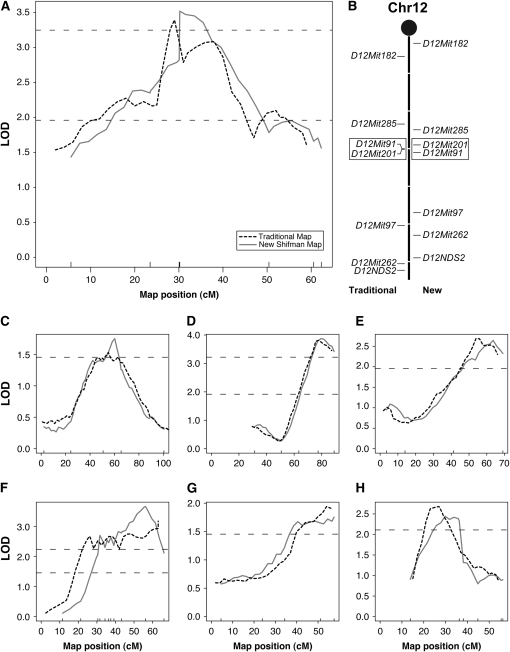
Figure 4.—
QTL With changes in peak shape. Seven QTL were found where the peak shape was altered due to subtle differences between the original and the revised Shifman maps. (A) The QTL for femoral BMD on chromosome 12 in the NZBxRF cross appears as a double peak when analyzed using the Mouse Genome Database (MGD)/traditional genetic map (dashed line), suggesting the presence of two closely linked QTL. When reanalyzed using the new genetic map, this double peak is collapsed into a single peak (solid line). (B) This double peak is the result of two flipped neighboring markers. Seven markers were typed in this cross for chromosome 12. The markers are placed on the centimorgan scale (center line) in relation to the MGD/traditional map (left) and the new genetic map (right). Note the difference in spacing of the markers when comparing the two maps. The other QTL with a change in peak shape were found for: (C) B6xCAST on chromosome 2, (D) B6xC3H on chromosome 2 for vBMD, (E) NZBxRF on chromosome 4 for vBMD, (F) B6xCAST on chromosome 14, (G) B6xCAST on chromosome 18, and (H) NZBxSM on chromosome 19.

