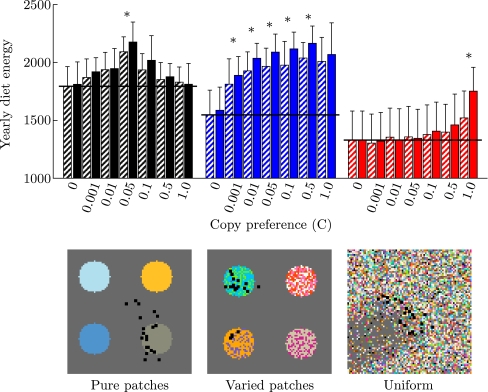
Fig. 2.
Effect of copy preference (C) on yearly diet energy in different resource distributions: Pure patches (black), varied patches (blue), and uniform environment (red). Horizontal black lines indicate individual learning baseline (C = 0). Bars are averages of 20 simulations at year 20 (striped bars) and year 100 (solid bars), where error bars are standard deviation. Note that standard deviation in the data sets (indicated by error bars) is large because it includes large intragroup variation due to age differences between individuals. Significant differences between the two time points are indicated by asterisks. Bottom: snapshots (80 by 80 m) showing resource distributions (black squares are individuals, gray is background, colors are resources)

