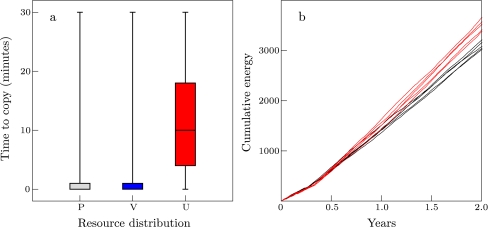
Fig. 3.
Copying opportunities and collective learning. a Box plots showing the time (minutes) it takes individuals to copy (C = 1.0) after observing feeding, for pure (gray) and varied patches (blue) and uniform environment (red). Box plots represent five simulations and show maximum and minimum, upper and lower quartile, and median. We include data of the first 5 years. b Average cumulative diet energy with (red, C = 0.5) and without (black) copying in the first 2 years in naïve groups (varied patches). Five simulations are shown for each condition

