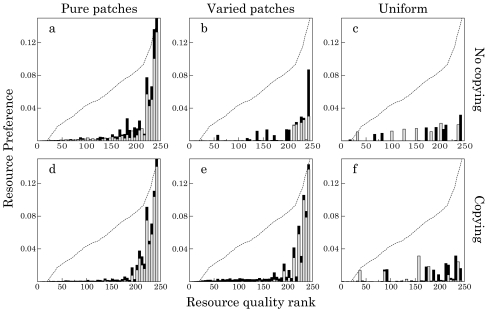
Fig. 4.
Preference profiles with (bottom row) and without copying (top row) in different environments. Preferences (bars) are shown for one 5-year-old (gray) and one 20-year-old individual (black). Note that black bars are behind gray bars. An individual’s familiarity with a resource can be expressed as its resource preference (pir, bars) divided by resource quality (qr, indicated by the dotted line). Left: pure patches, middle: varied patches, right: uniform environments. For copying, we show those cases where copying is most effective: dC = 0.05, eC = 0.5, fC = 1.0. Bin size = 5 resources

