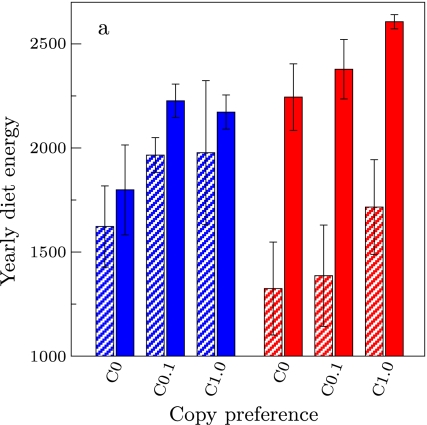
Fig. 5.
Impact of digesting mixture of resources on diet energy uptake in varied patches (blue) and the uniform environment (red). Striped bars: default preference development (see Eq. 1). Solid bars: preference development without digestive feedback over resources (in Eq. 1 (main article),  is replaced by qr for each resource). The impact of copying is shown for C = 0.1 and C = 1.0. All bars are averages of five simulations at year 100 and error bars are standard deviation

