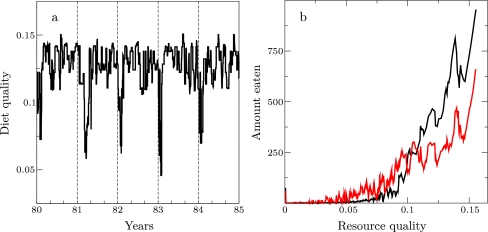
Fig. 6.
Excessive copying in patchy environments. a Diet quality in time (years 80 to 85) for maximal copying preferences (C = 1.0) in varied patches. b Resource feeding distributions with (red, C = 1.0) and without copying (black) of individuals with perfect knowledge in pure patches. Lines indicate how much resources of different quality are eaten (average of group for year 100)

