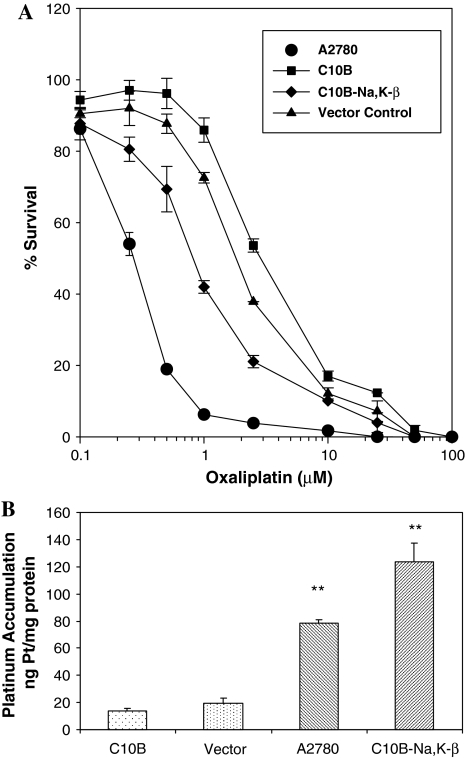
Fig. 2.
a Growth inhibition dose response curves for A2780, C10B, C10B-Na,K-β and vector control following a 72 h exposure to oxaliplatin. Data represents percent growth as determined by (OD 570 of treated cells/OD570 of untreated cells) × 100. Data represent mean ± SD, n = 3. IC50’s A2780: 0.2 μM; C10B: 3 μM; C10B-Na,K-β: 1 μM and Vector: 2 μM. b Accumulation of Pt in C10B, Vector control, A2780 and C10B-Na,K-β following oxaliplatin treatment. Platinum accumulation following exposure to 100 μM oxaliplatin for 2 h. Data represent mean ± SD, n = 3. The ** represent statistically highly significant difference compared to C10B or vector (P < 0.001). The difference between A2780 and C10B-Na,K-β is also statistically significant (P = 0.005)

