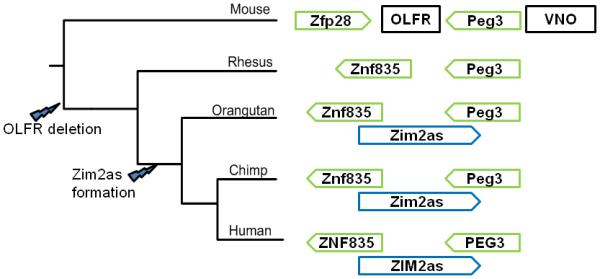
Figure 5. Primate-specific changes in the PEG3 region.

The tree is only representative of the relative relationship between these four animals, and branch lengths are not to scale. For simplicity, only selected genes are shown in this figure. The directional arrows show the direction of transcription of selected genes in this region, and the boxes show the positions of the olfactory receptor (OLFR) and vomeronasal organ receptor (VNO) gene clusters that flank the Peg3 imprinted domain in the mouse. The approximate timings of the olfactory receptor cluster deletion and Zim2as transcript formation are shown on the tree.
