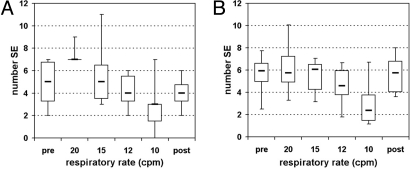
Fig. 1.
Box plots showing the number of SE at different respiratory rates in the original (A) and surrogate (B) data. Note that at 20 cpm in the original data (A), five of the six subjects have 7 SE and one had 9 SE and therefore the interquartile box consists of a line at the value 7. Also, as there were 20 surrogate datasets for each original, the number of SE found in the surrogate data for each respiratory condition was divided by 20 for comparability. (pre, post: datasets of spontaneous breathing before and after controlled breathing.)

