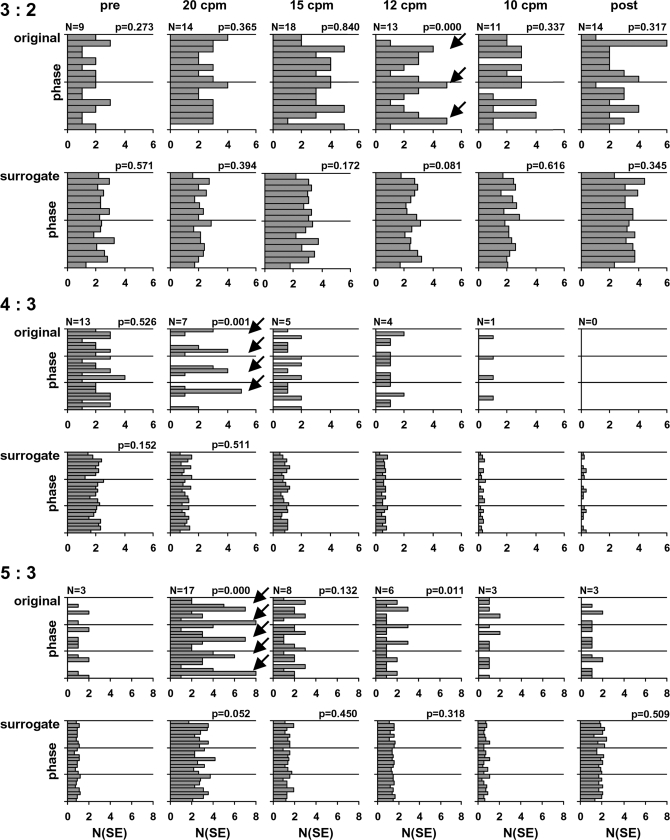
Fig. 2.
Distribution of the SE over the maternal beat phases in the original and surrogate data with respect to the n:m combinations 3:2, 4:3, and 5:3 in the different respiratory conditions. For the original data, the number of SE found is given at the top left of each graph. As there were 20 surrogate datasets for each original, the number of SE found in the surrogate data were divided by 20 for comparability. The arrows indicate clear phase preferences. P values are given for histograms containing at least 6 SE. (pre, post: datasets of spontaneous breathing before and following controlled breathing.)

