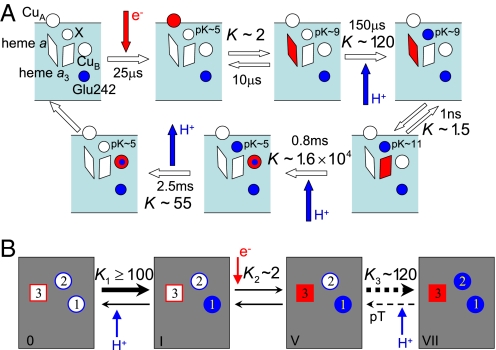
Fig. 2.
CcO reaction cycle. (A) Measured equilibrium constants and rates along a proposed reaction sequence in the absence of membrane potential (red, electrons; blue, protons; X, pump site) (20). (B) Experimental equilibrium constants in terms of the states of the three-site model. The dashed arrows in the last reaction (V-VII) indicate that the reaction is a two-step process consisting of the pT followed by the uptake of a proton from the N side.

