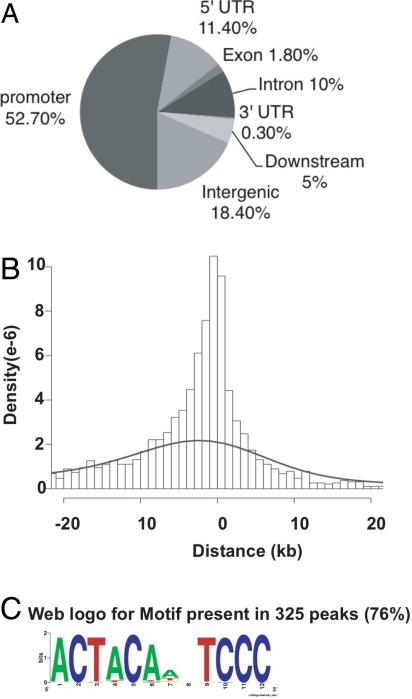
Fig. 2.
Genome-wide distribution of ChIP-seq peaks. (A) Location of SREBP-1 binding peaks relative to known genes. The promoter and downstream regions are defined as 2 kb of 5′ or 3′ flanking DNA. (B) Peak distance relative to TSS of the closest gene. The dashed line shows the distribution of a random sequence of DNA the same size as the average peak. (C) The 426 peak regions were analyzed for overrepresented motifs using MEME (14). The top-scoring motif is shown.

