Fig. 1.
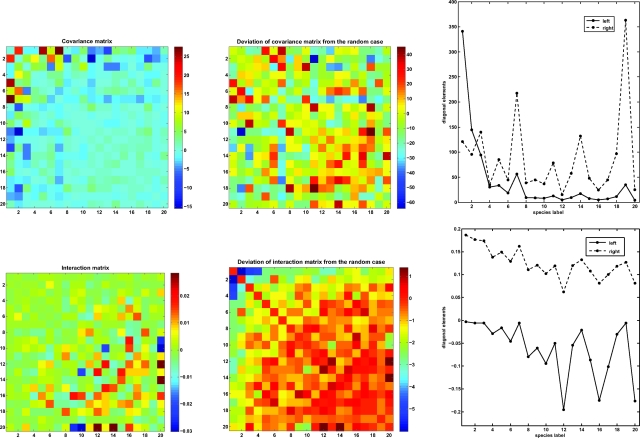
Plots of covariance and interaction matrices for the top 20 species in the BCI forest. (Left) Plots of the covariance matrix Σ (Upper) and the interaction matrix M (Lower) deduced by using the stochastic dynamics framework. For ease of viewing, the diagonal elements have been set equal to zero because they are typically larger than the off-diagonal entries (see SI Text). (Center) Deviation of the covariance (Upper) and interaction (Lower) matrices from the randomized BCI dataset in units of standard deviations of the randomized plots, again with the diagonal entries set equal to zero. We generated 1,000 plots with randomly shuffled species labels—this was accomplished by repeatedly picking a pair of individuals randomly and interchanging their species labels. This procedure ensured that the total abundance of each of the species was held fixed. (Right) The diagonal values are shown with the values of the diagonal of the lower center matrix reduced by a factor of 100. There is a strong (88%) correlation between the intraspecific interactions and the sum of the absolute values of the interspecific interactions. The species with the overall strongest interactions are species 20 and 12 (Virola sebifera and Sorocea affinis, respectively). Even though the interactions are relatively weak, there are several interactions that deviate from those obtained with a random placement of trees and are thus sensitive to the spatial distribution of species in the BCI forest.

