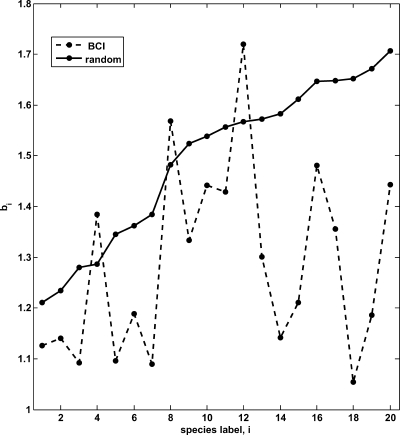
Fig. 2.
Per-capita birth rates for the 20 most abundant species in the BCI forest and for the randomly reshuffled case using the stochastic dynamics framework. The per-capita birth rate b i, measured in units of the death rate, is plotted versus species label. Species are labeled according to their ranking in terms of their abundance, with species 1 being the most abundant. For the random case, b i increases monotonically as the species abundance decreases.

