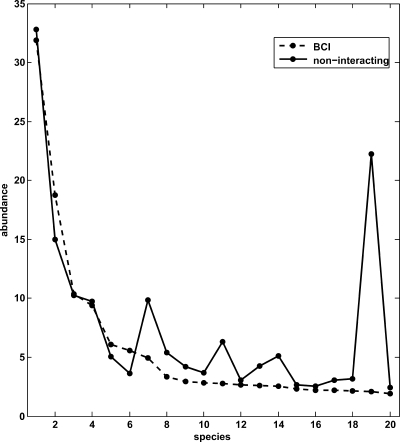
Fig. 3.
Plots of the average abundances of the 20 most abundant species in a quadrat. Dashed line, actual abundances in the forest; solid line, abundances calculated by using the interactions deduced from the stochastic dynamics approach with the interspecific interactions being turned off. Here, we used the birth rates and intraspecific interaction coefficients obtained by the stochastic method described in the article and solved the master equation for the probability distribution of the abundances of each species (see SI Text for details). The noninteracting system yields abundances in good accord with data except for the 19th species, Rinorea sylvatica, which has much lower abundance than predicted by the noninteracting model. Indeed, unlike other species, the self-interaction coefficient for R. sylvatica is small and comparable with its interspecific interaction coefficients. Note also the unusual highly clustered spatial distribution of trees of this species (see Fig. S2) reflected in Fig. 1 Upper Right. The figure shows that even though the composition of the majority of species in the BCI forest can effectively be described through a noninteracting model, there do exist species for which it is necessary to consider interspecific interactions.

