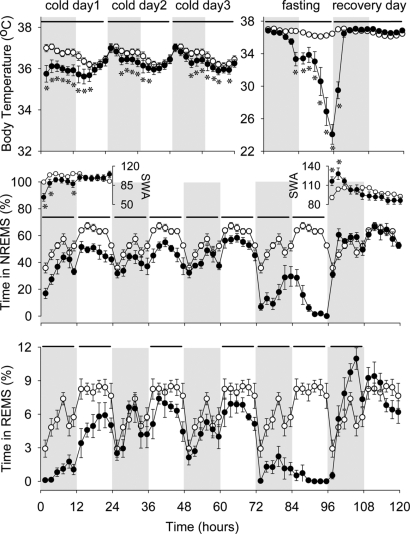
Fig. 2.
Body temperature (Top), NREMS (Middle), SWA (Insets), and REMS (Bottom) of preproghrelin KO mice during the course of the experiment. On the baseline day, body temperature, NREMS, REMS, and EEG delta power during NREMS showed normal diurnal rhythms. The 5-day experimental manipulation had significant effect on NREMS [ANOVA, day effect F(5, 55) = 81.4, P < 0.05] and REMS [ANOVA, day effect F(5, 55) = 77.2, P < 0.05]; these effects were different in WT and KO mice [ANOVA, day × genotype interactions for NREMS F(5, 55) = 11.3, P < 0.05; for REMS F(5, 55) = 5.8, P < 0.05]. Similarly, body temperature and EEG SWA were also significantly altered during the experiment. Preproghrelin KO mice already showed increased sensitivity to cold challenge, as indicated by reduced body temperature, NREMS, and REMS, throughout the 3 days of cold exposure. On the fasting day, body temperature, NREMS, and REMS were severely suppressed in preproghrelin KO animals. On the recovery day, body temperature was elevated, and the amount of NREMS and REMS, after an initial increase, returned to baseline levels. Two of the 8 KO mice died during the recovery day; data from those animals are excluded from the recovery day. Open symbols: baseline day (plotted 5 times); solid symbols: experimental days. Data points represent 2-h averages. Horizontal bars for temperature: significant difference from baseline day (2-way ANOVA); horizontal bars for NREMS and REMS: significant difference between the baseline and experimental days (univariate tests of significance for planned comparison, P < 0.05). Error bars: standard error; gray shaded area: dark phase of the day; asterisk: significant difference in body temperature or SWA between the baseline and experimental days (univariate tests of significance for planned comparison, P < 0.05). Note the difference in the temperature y-scale between the cold days and the fasting/recovery days.

