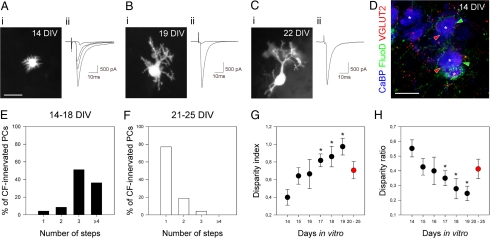
Fig. 1.
Selective synapse elimination and stabilization occur in developing hindbrain explants until mono-innervation is reached. (A–C) Examples of recorded PCs from developing explants at 14 DIV (A), 19 DIV (B), and 22 DIV (C). At 14 DIV, nonpolarized PCs display short perisomatic dendrites (Ai) and multiple CF-EPSCs (Aii), indicating CF multi-innervation. At 19 DIV, PCs are elaborating their dendritic trees (Bi); some of them display multiple steps CF-EPSCs (Bii), indicating CF-multi-innervation, but the disparity between the amplitudes is high (Bii). At 22 DIV, PCs have elaborated a polarized dendritic tree (Ci), and most of them display single CF-EPSC (Cii), indicating CF mono-innervation. Holding potential was −80 mV for all cells. (D) Confocal section showing triple labeling for CaBP (blue), VGLUT2 (red), and anterograde-labeled CFs (green) at 14 DIV. Some VGLUT2-positive puncta (red arrowheads) do not colocalize with anterograde-labeled CF terminals (green arrowheads) on the same PC (asterisks), illustrating CF multi-innervation. (E and F) Histograms showing the percentage of PCs displaying from one to four or more CF-EPSCs steps at 14–18 DIV (E) and 21–25 DIV (F). (G and H) Developmental changes in the disparity index (G) and ratio (H). Each data point corresponds to the mean ± SEM from 6–18 cells. Data for 20–25 DIV are pooled and appear in red. (Scale bars: A1, B1, C1, 30 μm; D, 20 μm.)

