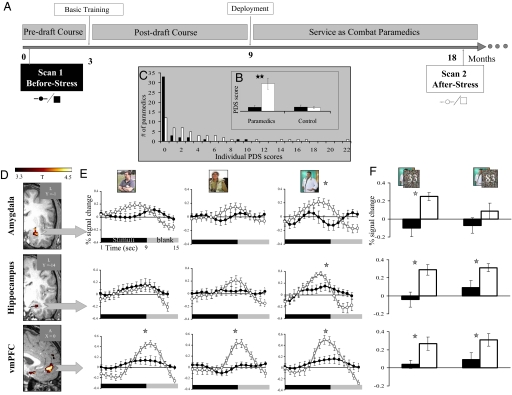
Fig. 1.
(A) Timeline (months) of the prospective imaging study. Each participant was examined at 2 time points separated by ≈18 months. (B) Rating of stress symptoms at each time point according to the Posttraumatic Stress Diagnostic Scale (PDS), one-tailed paired t-test analysis. (C) The distribution of individual PDS scores Before Stress and After Stress in the paramedics group. (D) Slice views obtained from whole-brain parametric maps for the contrast (After Stress > Before Stress). Increased activation After Stress is shown in the left amygdala (coronal view, Upper) left hippocampus (coronal view, Middle), and vmPFC (sagittal view, Lower) (P < 0.0005, uncorrected, random effect). (E) Averaged percent signal changes extracted from each ROI for After Stress (open circles) and Before Stress (filled circles) separately for each content (civilian, military, and medical, left to right, respectively) regardless of presentation durations. Activation values were resampled at a rate of 1:3 for visualization purposes only. (F) Bar graphs presenting averaged percent signal changes per duration in the medical content (33 and 83 ms, left and right, respectively) in each scan time point. Post hoc analysis was calculated using Fisher's LSD (n = 37; error bars ± SEM; *P < 0.05; **P < 0.0001).

