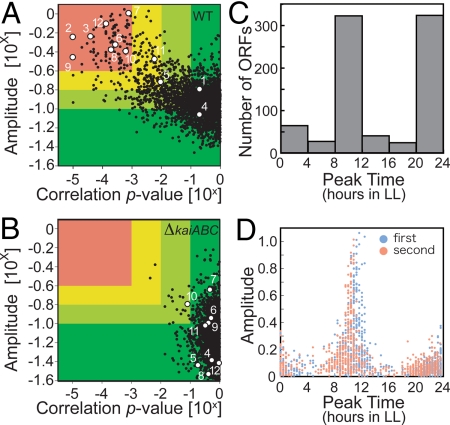
Fig. 1.
Analysis of genome-wide circadian transcription profiles under LL conditions. (A and B) Variations in the oscillatory indexes; amplitude (ordinate) and a cosine-fitting correlation score (correlation P value; abscissa) from each transcript under LL conditions in wild-type (WT; A) and in kaiABC-null (ΔkaiABC; B) strains. Definition of each score is described in SI Methods. Briefly, a higher amplitude indicates the standard deviation (SD) normalized to the mean value representing larger fluctuations, and a lower P value means better correlation to a periodic (sinusoidal) waveform with a 24 h period. Eight hundred “cycling genes” were identified with an amplitude of >0.1 and a P value of <0.1. For more stringent filtration, the lower amplitude and higher P value from 2 independent experiments were used to ensure reproducibility. The numbers in the panel indicate scores of 12 rhythmic or arrhythmic genes: point 1, kaiA; point 2, kaiB; point 3, kaiC; point 4, sasA; point 5, rpaA; point 6, cikA; point 7, rpoD5/sigC; point 8, rpoD6; point 9, purF; point 10, pilH/rre7; point 11, ctaC; and point 12, opcA. (C and D) Phase distributions of the peak expression times of 800 circadianly expressed genes. The numbers of ORFs (C) or the amplitudes from 2 independent experiments (D) are plotted on the ordinate.

