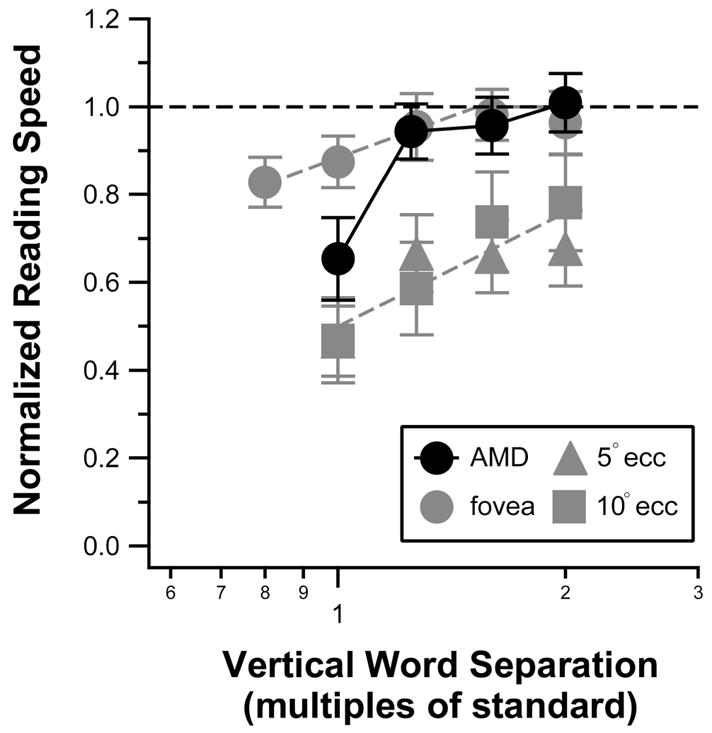
FIGURE 3.

Normalized reading speed (reading speed at a given vertical word separation normalized to the unflanked reading speed) averaged across the four AMD subjects who participated in experiment 2, is plotted as a function of the vertical word separation as black circles. For comparison, averaged data obtained from the fovea, 5° and 10° lower visual fields of a group of normally sighted young adults are included as gray symbols (data are replotted from Fig. 6 of Chung, Optom Vis Sci 2004;81:525–35). Error bars represent ± 1 SEM. The dashed line represents reading speeds that are the same as the unflanked word reading speed.
