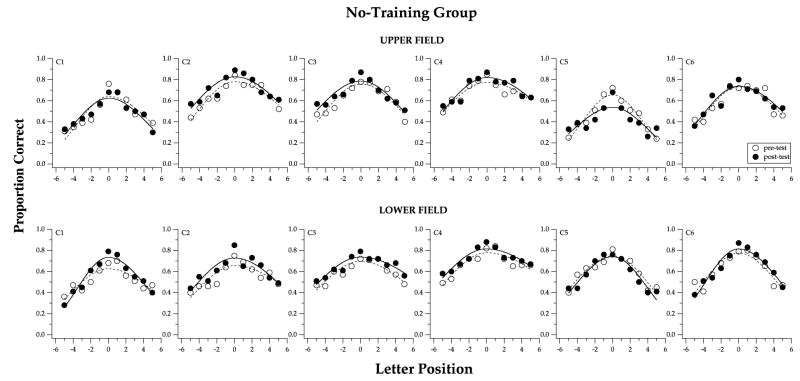
Fig. 3.
Visual-span profiles, plots of proportion correct of letter-recognition vs. letter position, are compared between pre- (unfilled symbols) and post-test (filled symbols), for the six observers of the no-training group (C1–C6). Measurements obtained at 10° in the upper visual field are given in the top panels and those obtained at 10° in the lower visual field are given in the bottom panels. Note that there is very little difference between the two visual-span profiles in each panel.

