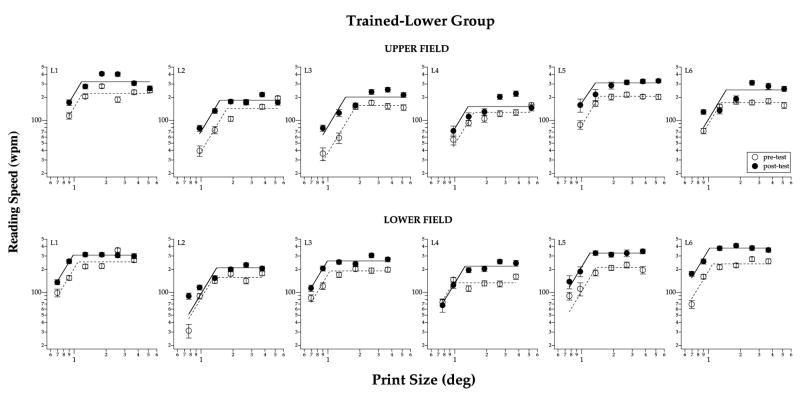
Fig. 6.
Reading speeds as a function of print size are compared between pre- (unfilled symbols) and post-test (filled symbols), for the six observers of the trained-lower group, and at 10° in the upper (top panels) and lower (bottom panels) visual fields. The post-test plot is shifted upward from the pre-test plot in most cases, implying an improvement in the maximum reading speed. Error bars represent ±1 standard error of estimate of the reading speed at the 80% correct level.

