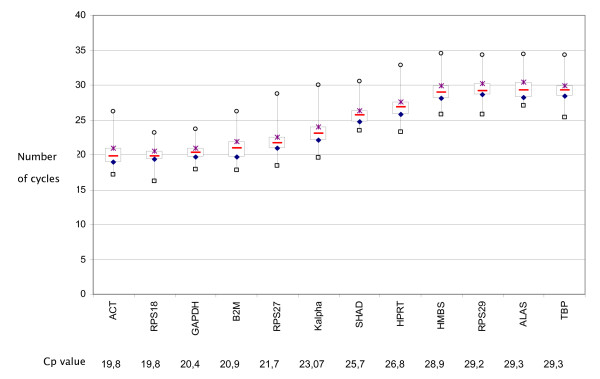
Figure 1.
mRNA expression of 12 reference genes in HNSCC tissue and matched normal mucosa. Raw Cp values are represented for each gene by a box-plot. The central box represents the interquartile interval, the red line inside the box is the median value, and the extreme values represent the minimum and maximum values. Cp (Crossing point).

