Figure 4.
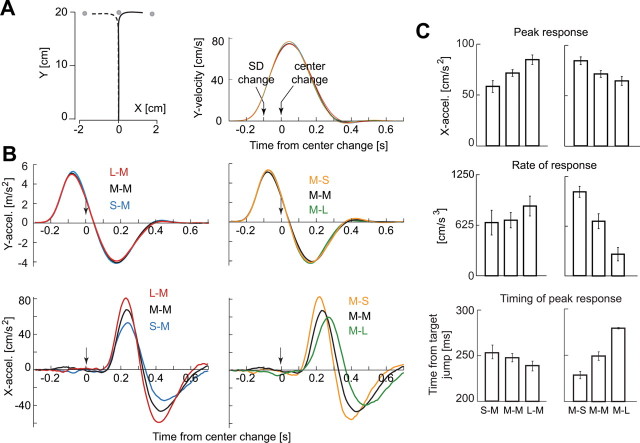
Control experiment 2. A, Left, Mean hand paths of the response induced by target jump. The mean was calculated with data across all subjects. Right, Temporal patterns of y velocity. B, Top, The response along the y-axis was indistinguishable across various conditions. Bottom, However, changing the target uncertainty produced clear variations in the response along the x-axis. When the uncertainty associated with the first target was small with respect to the second target, the motor response to the second target was large. When the uncertainty associated with the first target was large with respect to the second target, the response was small. The peak and zero-crossing points were delayed when the peak response increased. C, There were main effects associated with target uncertainties in peak response (top), rate of initial response (middle), and time of peak response (bottom).

