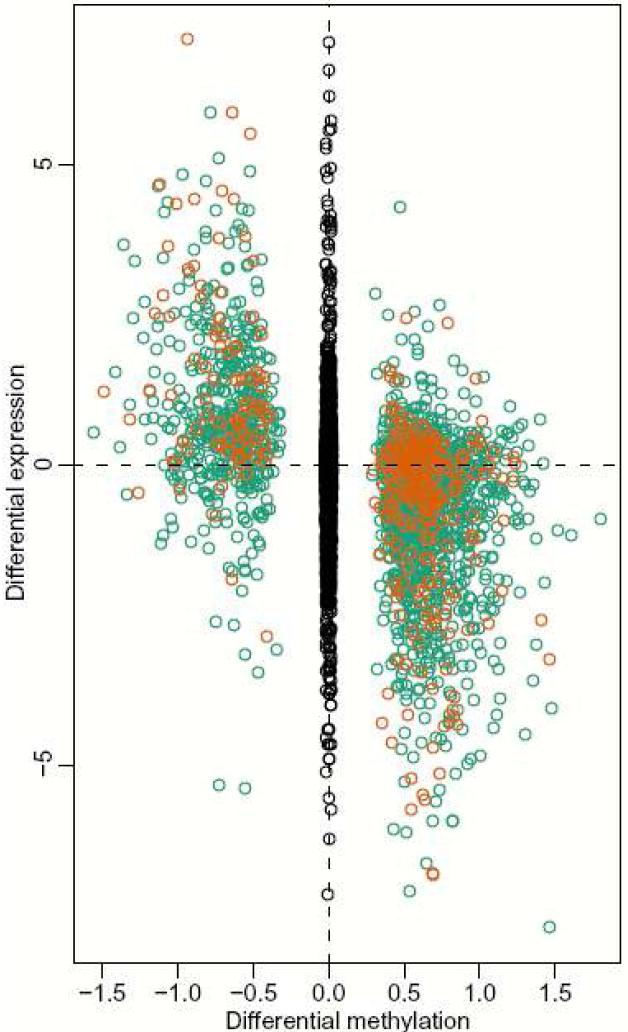
Figure 4.
Gene expression is strongly correlated with T-DMRs at CpG island shores. For each brain versus liver T-DMR we found the closest annotated gene on the Affymetrix HGU133A microarray, resulting in a total of 2,041 gene/T-DMR pairs. Plotted are log (base 2) ratios of liver to brain expression against delta M values for liver and brain DNAm. Orange dots represent T-DMRs located within 300 bp from the corresponding gene's transcriptional start site (TSS). Green dots represent T-DMRs that are located from 300-2000 bp from the TSS of an annotated gene. Black dots, in the middle, represent log ratios for all genes further than 2 kb from an annotated TSS.

