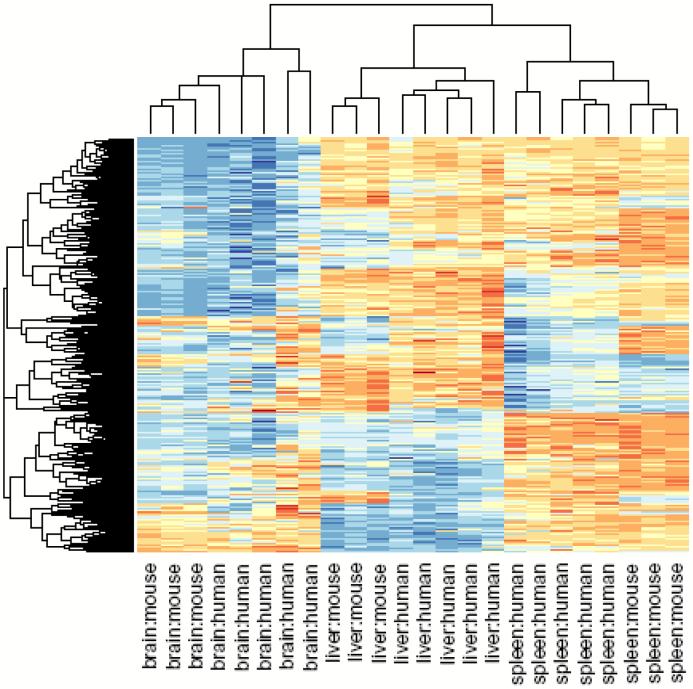
Figure 6.
Clustering of human tissue samples using mouse T-DMRs results in perfect discrimination of tissues. The M values of all tissues from the 1,963 regions corresponding to mouse T-DMRs that mapped to the human genome were used for unsupervised hierarchical clustering. By definition, the mouse tissues are segregated. Surprisingly, all of the human tissues are also completely discriminated by the regions that differ in mouse tissues. The three major branches in the dendrograms correspond perfectly to tissue type regardless of species. Columns represent individual samples, and rows represent regions corresponding to mouse T-DMRs. The heatmap displays M values, with red being more methylated and blue less.

