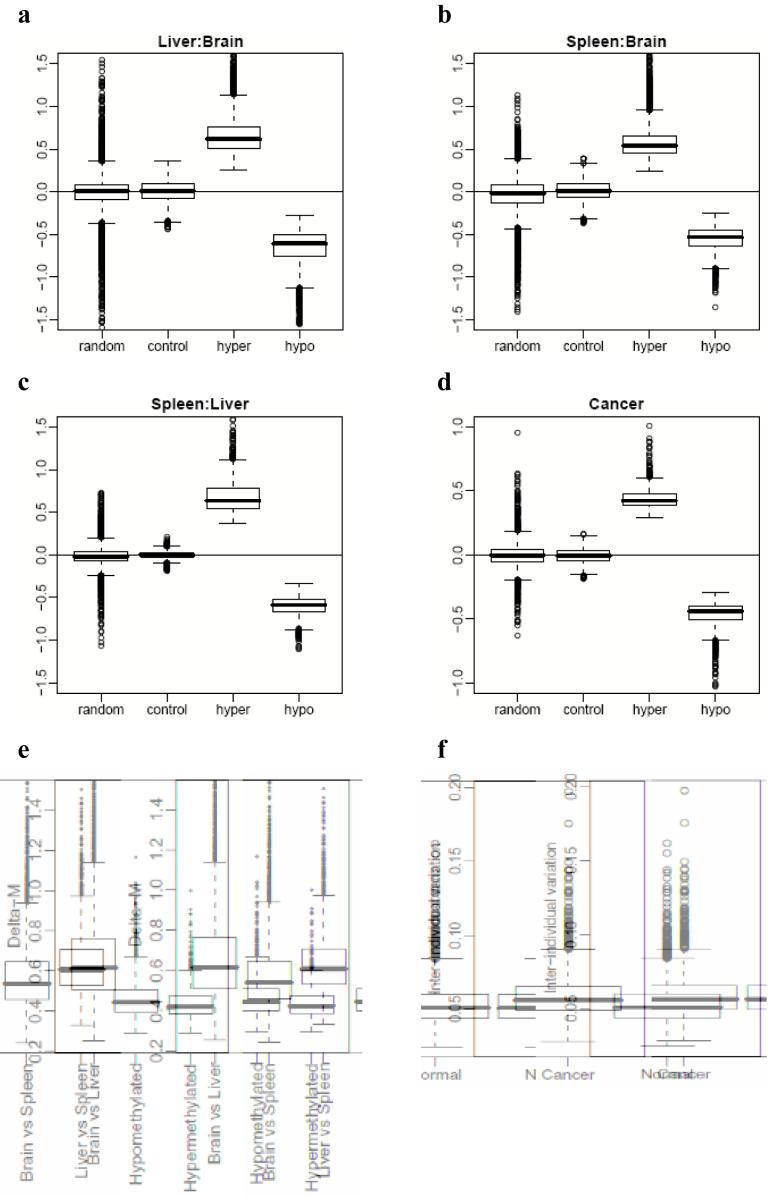
Figure 8.
Magnitude of differential methylation and variation in C-DMRs and T-DMRs. (a-d) Boxplots of average delta M values over all DMRs, compared to randomly chosen regions and unmethylated control regions, matched for length. (a) Liver versus brain, (b) spleen versus brain, (c), spleen versus liver, (d) colon cancer versus normal colonic mucosa. (e) Differences in DNA methylation are greater in magnitude among normal tissues than are differences between colon tumors and matched normal mucosa. For all DMRs we computed the average delta M. We then stratified these values into T-DMRs, hypermethylated C-DMRs and hypomethylated C-DMRs. T-DMRs were further stratified according to brain versus liver, brain versus spleen, and liver versus spleen pairwise comparisons. The box-plots represent absolute values of the delta Ms. (f) Inter-individual variation in M is larger among colon tumors than matched normal mucosa. For each C-DMR we computed the average inter-individual standard deviation of the Mvalues. The box-plots represent these values for normal colon mucosa and colon tumors.

