Abstract
In this article, a shim method that minimizes the maximum off-resonance frequency (min-max shim) in balanced steady-state free precession (bSSFP) is tested for brain imaging at 3 T with contrast and linear shim terms. The method demonstrates improvement of spatial coverage and banding artifact reduction over standard least-squares shimming. In addition, a new method (modified min-max shim) is introduced. This method reduces boundary band regions where the artifact is inevitable due to the excessive off-resonance frequency distribution. In comparison to standard least-squares shimming, the min-max based shim method either eliminate or reduce the size of banding artifacts. The method can be used to increase the SNR in bSSFP imaging or to increase the functional contrast in bSSFP fMRI by allowing a longer usable repetition time (TR).
Keywords: min-max, minimax, least-squares, shimming, shim, SSFP
Introduction
In MRI, magnetic field shimming is a critical step for acquiring high quality images. Almost every scan session starts with a shim protocol to reduce the spatial field inhomogeneity in the imaging volume. Most modern scanners are equipped with zeroth and first order shim coils, and many are also equipped with higher order shims to compensate for the complex field inhomogeneity introduced by the human body. Several shim algorithms and techniques have been developed using linear shim methods (1–4), higher order shim methods (5–9), dynamic or real-time shim update methods (10–13), and local field correction shim methods (14,15).
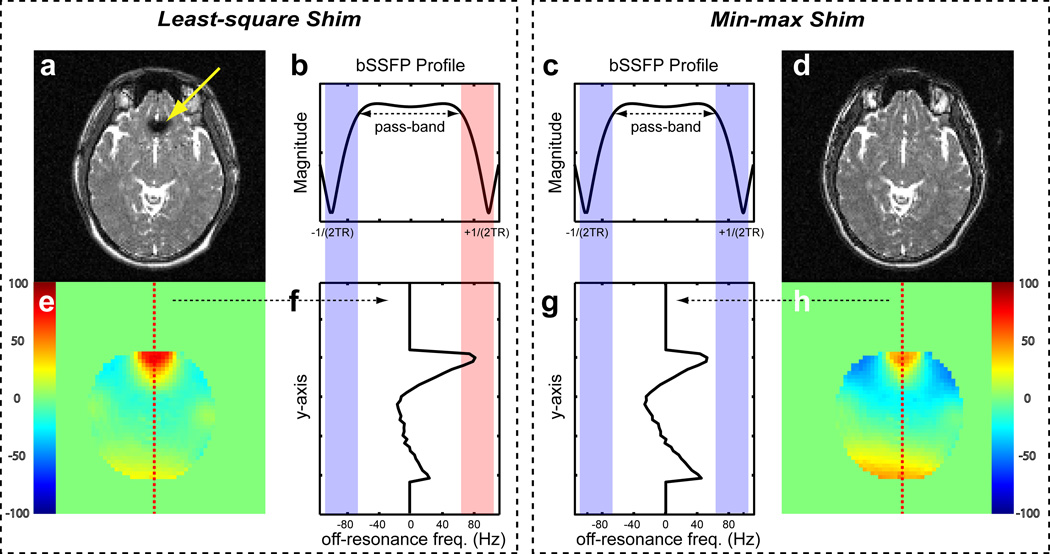
In balanced steady-state free precession (bSSFP, also referred to as FIESTA, TrueFISP, balanced FFE, (16)) shimming an imaging volume or region of interest (ROI) is particularly important because the signal is susceptible to significant drops in intensity (e.g., the banding artifact) as a function of off-resonance frequency and dark bands appear periodically with a period of 1/(2TR) Hz (Fig. 1b). If shimming is not properly performed or the off-resonance distribution is wider than the flat magnitude frequency range in the bSSFP profile (pass-band in Fig. 1b), the banding artifact is observed (Fig. 1a). To remove this artifact, a very short TR (few milliseconds) is commonly used to increase the off-resonance frequency coverage. Alternatively, multiple acquisitions are obtained, each with shifted center frequencies (17). However, using a short TR or multiple acquisitions are not always favorable. Multiple acquisitions increase the total scan time. A short TR decreases the data acquisition efficiency and increases the specific absorption rate (SAR). In bSSFP fMRI (18–20), a recent fMRI method for high-resolution functional studies, a short TR decreases the level of functional contrast since the relative signal change depends linearly on TR (20). Therefore, it is favorable to use a longer TR with a single acquisition, while keeping the imaging volume or ROI free of banding artifacts.
Figure 1.
Conceptual illustration of the advantage of the min-max shim method in bSSFP imaging. (a and d) The bSSFP image. (b and c) The bSSFP magnitude profile. The flat magnitude off-resonance frequency range is referred to as the pass-band. (e and h) The color coded field map of the slice (in Hz). (f and g) The off-resonance distribution of the central line in the field map (the red dotted line in e and h). When the min-max shim is used, the peak off-resonance frequency is reduced allowing an artifact-free image.
One way to reduce the field inhomogeneity and increase the banding free spatial coverage is to optimize the shim parameters for bSSFP imaging. Most of the previously mentioned methods try to find the shim values that minimize the mean square of the residual field (least-squares shim) in the ROI or imaging volume (2). However, this least squares shimming does not guarantee the largest spatial region without banding artifact. In bSSFP the actual off-resonance frequency of a voxel does not matter as long as it stays within the pass-band of the bSSFP profile, approximately within 80% of ±1/(2TR) Hz. Therefore, a better shim algorithm can be designed to utilize the tolerance of bSSFP to off-resonance frequency within the pass band. Based on this observation, adjusting the center frequency has been proposed for cardiac applications (21,22). However, this solution is not optimal as it uses only the zeroth order shim. In this paper, we propose a new method that utilizes both zeroth and first order shim coils for a better spatial coverage. The method minimizes the maximum off-resonance frequency (min-max shim in ref. 2) within an ROI to improve the off-resonance coverage in bSSFP. Combined with this min-max shim, we developed an approach that ensures reduced artifact regions compared to the least-squares shim when the banding artifact is unavoidable (modified min-max shim). This new shimming method was applied to the bSSFP brain imaging to demonstrate the improvement over the traditional least-squares method.
Methods
The conceptual illustration of the min-max shimming method is shown in Figure 1. Least squares shimming reduces the average squared off-resonance frequency. Therefore, the method is likely to penalize a small region (e.g., the frontal lobe area) while reducing the overall off-resonance frequency in other regions. The resulting field map may exhibit a large peak off-resonance region as shown in Fig. 1e and f. In bSSFP, this large peak off-resonance can result in banding artifacts (the yellow arrow in Fig. 1a, and the red strip in Fig. 1f). In some cases, one can manipulate the shim parameters such that the maximum off-resonance frequency is reduced to avoid the artifacts (Fig. 1g and h). In this example, the center frequency and y-shim were modified to decrease the peak off-resonance frequency. The resulting field map has a larger mean square error compared to the least-squares shim result but the image has no artifact (Fig. 1d). Hence, one can achieve a wider spatial coverage by reducing the peak off-resonance frequency.
This approach can be restated as follows: in bSSFP, better spatial coverage can be obtained by minimizing the maximum absolute off-resonance frequency of the field map (min-max shim). It can be formulated as follows (2):
| [Eq.1] |
where F(x,y,z) is the field map; F0, Fx, Fy, Fz, Fxy, and Fxz represent the center frequency, x-shim, y-shim, z-shim, xy-shim, and xz-shim induced field basis vectors (or matrices); s0, sx, sy, sz, sxy, and sxz represent the variable shim values. Equation 1 can be reformulated as a linear program (2) and solved very efficiently (23). The resulting field map has the minimum peak off-resonance frequency with both positive and negative peaks the same absolute values. Based on the shim result, one can choose a TR that ensures artifact free images if the TR is longer than the minimum TR of the sequence.
If the choice of TR is constrained (for example, in bSSFP fMRI studies) and the off-resonance frequency of the volume is larger than the coverage obtained by the minimum TR, the resulting bSSFP image will inevitably contain banding artifacts. Moreover, the min-max shim can potentially create more banding artifacts than least-squares shim because both positive and negative off-resonance frequency peaks may create the artifact and their spatial location may appear in central portion of the image. For example, both orange and blue colored areas in Fig. 1h (min-max shim) can show the banding artifact for a certain TR, whereas only the red and orange colored area will have the banding artifact in the least-squares shim (Fig. 1e).
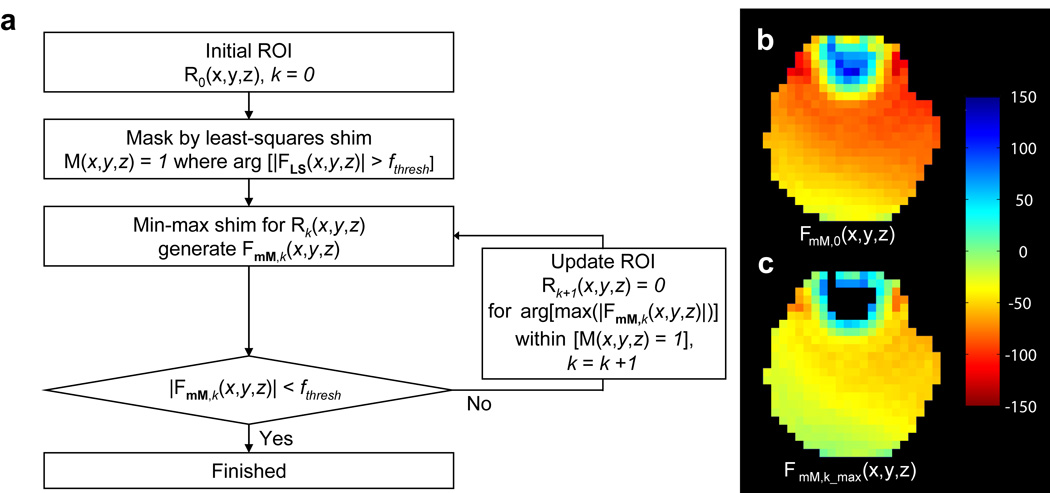
To avoid this problem, the min-max shim method needs to be improved. When the banding artifact is unavoidable due to excessive off-resonance, our goal is to reduce the size of banding artifact regions. Moreover, it is favorable to reduce the size of the banding artifact from the least-squares shim result without creating new banding artifacts at arbitrary locations. To ensure reduced banding regions compared to the least-squares result, we modified the min-max shim method as follows. First, a region of interest (ROI) where shimming is performed is chosen. The least-squares shim is performed for the ROI to generate a mask where the banding artifact is expected in the least-square shim results. The off-resonance frequency range for the pass-band, approximately 80% of ±1/(2TR), is set for a given TR. Then the regions where the off-resonance frequency is larger than the pass-band frequency coverage are calculated from the field map of the least-squares method. These regions are set to 1 in the mask. Since the off-resonance frequency is larger than the pass-band, some voxels within these regions, especially the boundaries of the regions, will have the artifact. Note that the least-squares shim is only used to create this mask. After setting the mask, the min-max method is iteratively performed. In each iteration, the ROI where the min-max shim is performed is updated by removing the peak off-resonance frequency voxel within the mask. The iteration is terminated when the peak off-resonance frequency of the ROI is smaller than the pass-band frequency coverage. This procedure is referred to as the modified min-max shim and is summarized in Figure 2. The resulting field map will have lower peak off-resonance frequency than the pass-band frequency range for the given TR and the banding artifact will only be observed in some of those voxels that were removed during the procedure. Since these voxels were within the mask that was generated by the least-squares shim, the resulting banding areas from the modified min-max shim will have reduced boundary banding regions compared to the least-squares shim result. If the peak off-resonance frequency is less than the pass-band frequency coverage after the first min-max shim, the modified min-max shim method becomes the original min-max shim method.
Figure 2.
(a) Flow chart for the modified min-max shim method. The Rk(x,y,z) represents the kth region-of-interest, M(x,y,z) represents the mask from the least-square shim, FLS(x,y,z) for the field map result of the least-squares shim, FmM,k(x,y,z) for the kth field map result of the min-max shim, and fthresh for the one side of frequency range of the pass-band (here, 80% of 1/(2TR)). The ROI was gradually refined by removing the peak off-resonance frequency voxel within the mask. (b) Initial field map result of the min-max shim. (c) Final field map result after the modified min-max shim. The frontal lobe area was removed from ROI during the procedure.
To demonstrate the efficacy of the proposed min-max shim method, experiments were performed using a 3 T GE EXCITE scanner (40 mT/m and 150 mT/m/ms). A GE standard head coil (transmit/receive) was used to acquire data. Five subjects who provided informed written consent were scanned under an IRB-approved protocol. A field map sequence and a bSSFP imaging sequence were developed for the experiments. For the field map sequence, an interleaved 2D GRE spiral sequence with two echoes was used (TR = 800 ms, TE1 = 1.5 ms, TE2 = 5.5 ms, flip angle = 70°, slice thickness = 4 mm with 1 mm gaps, FOV = 24 × 24 cm2, number of slices = 8, number of interleaves = 4, matrix size = 40 × 40, and BW = ±125 kHz). The phase images at the two echo times were unwrapped individually before generating the field map. The total scan time for the field map sequence was 5 seconds. For the bSSFP imaging, a Cartesian trajectory 3D bSSFP sequence (TR = 5 to 10 ms, TE = TR/2, FOV = 24 × 24 cm2, matrix size = 128 × 128, slab size = 40 mm, and slice thickness = 2.5 mm, BW = ±31.25 kHz) was used with a 180° RF cycling.
Two experiments, one for the min-max shim and the other for the modified min-max shim, were performed on each subject. First, the original min-max shim that was targeted for the band-free images was compared with the least-squares shim method at an upper brain area with moderate off-resonance. The scan session started with a 3D localization and the field map sequence followed. A region of interest (ROI) that excludes the non-brain area was selected manually based either on the magnitude or field map images. To avoid low intensity voxels which can induce large off-resonance frequency variations, a slightly tighter area was chosen for the ROI. Then, the shim values were calculated using the least-squares shim method and the scanner shim settings were adjusted accordingly. The field map sequence was repeated up to twice using the same ROI to measure and correct for the off-resonance field distribution. The bSSFP images (TR = 5 to 10 ms with a 1 ms step) were then acquired to see the results of the shim method. After the bSSFP imaging, the shim values were adjusted based on the min-max shim result. The field map sequence was scanned again, once or twice, to confirm the min-max shim result and the bSSFP images were obtained with the same TRs as in the least-squares experiments.
For the second experiment, a lower slab of the brain that had severe off-resonance was scanned to further evaluate the performance of the modified min-max shim. A fixed TR (5 ms) was used for the bSSFP imaging and the maximum allowable off-resonance frequency range was set to be the 80% of 1/TR (i.e. −80 Hz to 80 Hz). After selecting a slab for the imaging, the field map was acquired and a ROI was drawn manually. Then, the ROI was refined by excluding the excessive peak off-resonance frequency voxels as described in Figure 2 (modified min-max shim method). The shim parameters were adjusted based on the modified min-max shim result. The off-resonance frequency distribution was measured and corrected by up to two more runs of the field map sequence. Balanced SSFP images with a 5 ms TR were acquired. After that the shim parameters were adjusted to the least-squares shim with the same ROI. The field maps were acquired and corrected (up to two times) and the bSSFP sequence was run.
In both experiments, the order of the least-squares shim and the min-max shim was randomly reversed. For the shim parameters, the linear shim terms (x-, y-, and z-shim) and the resonance frequency (f0) were corrected. The shim terms were orthogonalized based on the measured field basis vector (9). The step size for the resonance frequency correction was 1 Hz, whereas it was 0.0015 mT/m for the linear shim parameters.
Results
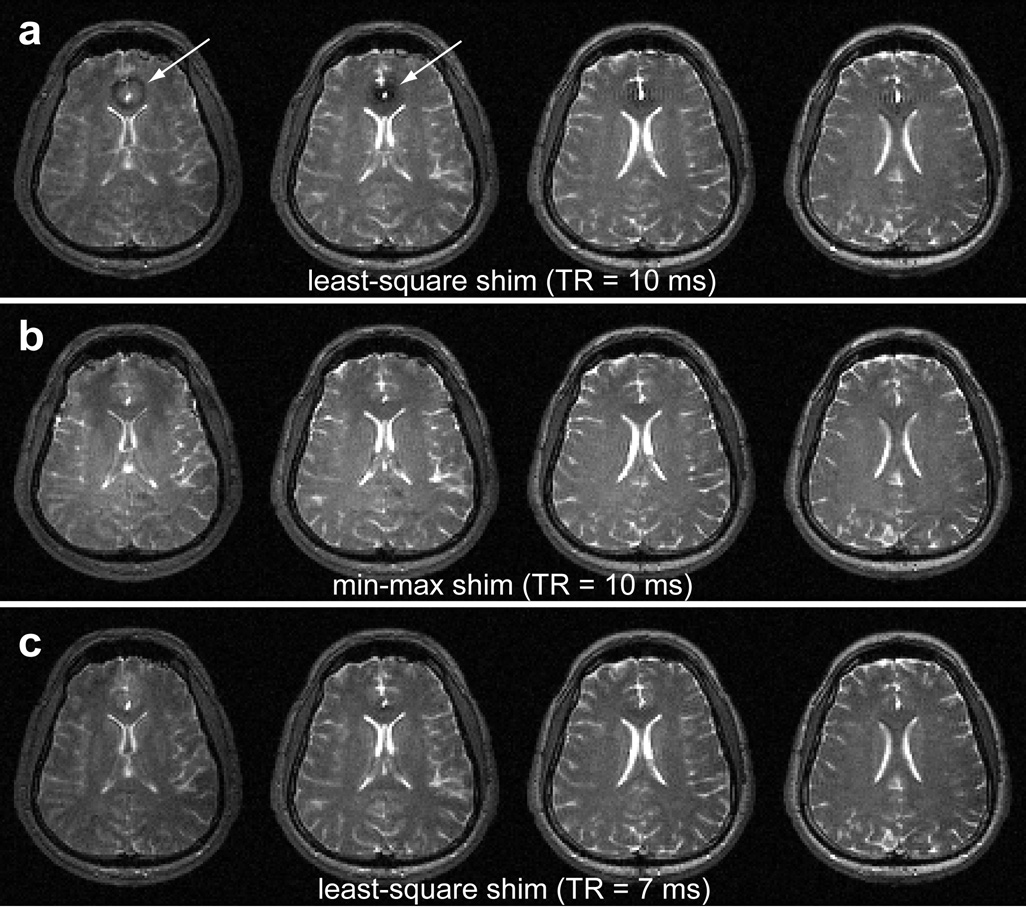
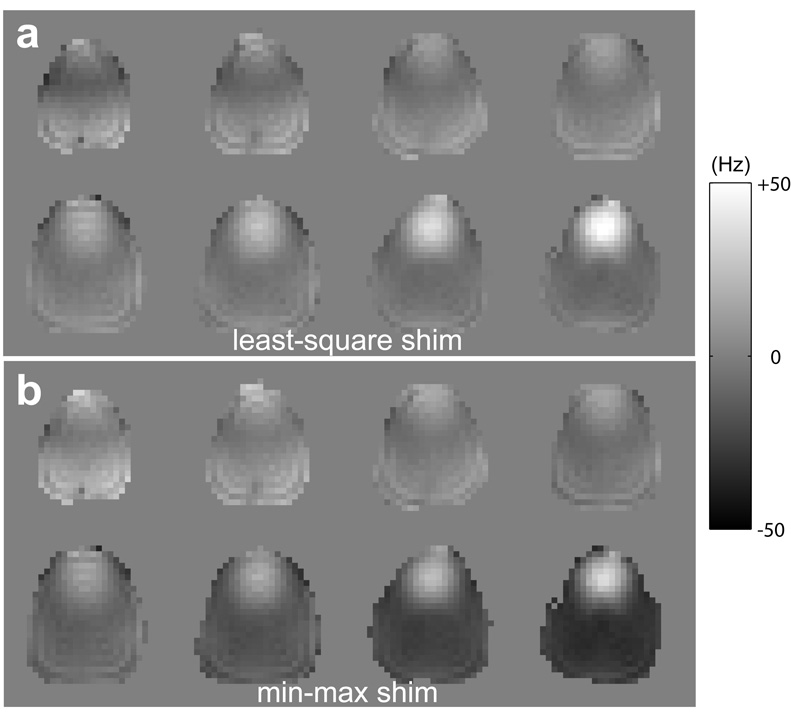
Figure 3 illustrates the improvement of the spatial coverage in the bSSFP imaging using the min-max shim method. When the least-squares shim was used, the banding artifact was observed in the frontal lobe of the brain (arrows in Fig. 3a). It disappeared when the shim was reconfigured to the min-max shim for the same TR (10 ms, Fig. 3b). A shorter TR (7 ms) was necessary to avoid the artifact in the least-squares shim (Fig. 3c). Hence, the min-max shim enabled to increase TR from 7 ms to 10 ms. The off-resonance frequency range measured by the field map was changed from [−33.6, +54.5] Hz (least-squares shim, Fig. 4a) to [−36.6, +36.2] Hz (min-max shim, Fig. 4b) showing a reduced peak off-resonance in the min-max shim method. When averaged over the five subjects, the peak off-resonance frequency was reduced by 39% (100*(fpk_LS−fpk_mM)/fpk_mM where fpk_LS represents the peak off-resonance frequency of the least-squares result and fpk_mM represents that of the min-max result) and the TRs were able to be increased by 1 to 3 ms when the min-max shim was used (Table 1). Regional banding artifacts at the edges of the frontal lobe of the brain were observed in both least-squares and min-max shim results (Figure 3). These artifacts are most likely to arise due to the tight ROI that did not properly cover the edge voxels and might have disappeared if the ROI were refined. Note that in four subjects, the min-max shim allowed us to use a longer TR by 1 to 2 ms compared to the least-squares shim when the TR was further reduced to make these artifacts unnoticeable (the numbers in the parenthesis in Table 1).
Figure 3.
Min-max shim result vs least-squares shim result. When the TR was 10 ms, the bSSFP images from the least-squares shim show the banding artifact (arrows) near the sinus area (a). The artifact disappeared when the shim was reconfigured to the min-max shim for the same TR (b). In the least-squares shim, the TR needed to be shortened to 7 ms to yield artifact free images (c).
Figure 4.
Field map measurements of (a) the least-squares shim and (b) the min-max shim methods. The min-max shim field map shows a reduced maximum off-resonance frequency in the frontal lobe area.
Table 1.
Summary of the results
| Experiment 1 (TR = 5 to 10 ms) | Experiment 2 (TR = 5 ms) | |||||
|---|---|---|---|---|---|---|
| Least-squares Shim method | Min-max Shim method | Least-squares shim method | Modified min-max shim | |||
| Off-resonance (Hz) | TRa,b (ms) | Off-resonance (Hz) | TRa,b (ms) | cOff-resonance (Hz) | cOff-resonance (Hz) | |
| 1 | −42.0 to 49.7 | 8(< 5) | −39.5 to 36.4 | 9(< 5) | −62.4 to 113.2 | −86.8 to 76.5 |
| 2 | −45.2 to 58.5 | 6(< 5) | −48.4 to 48.6 | 7(5) | −48.2 to 135.7 | −81.1 to 79.1 |
| 3 | −42.7 to 78.0 | 5(5) | −43.6 to 43.7 | 8(6) | −62.9 to 112.0 | −76.0 to 76.0d |
| 4 | −33.6 to 54.5 | 7(7) | −36.6 to 36.2 | 10(9) | −51.8 to 127.8 | −83.7 to 78.2 |
| 5 | −45.7 to 62.7 | 7(< 5) | −50.1 to 52.3 | 9(6) | −53.2 to 115.1 | −81.1 to 77.4 |
The maximum TR that showed no significant banding artifact in the bSSFP imaging.
The number in the parenthesis represents a TR that shows no discernable banding artifact even at the edges of the images.
Off-resonance frequency ranges are based on the ROI after removing excessive off-resonant voxels by the modified min-max shim method.
The off-resonance frequency range was calculated from the field map.
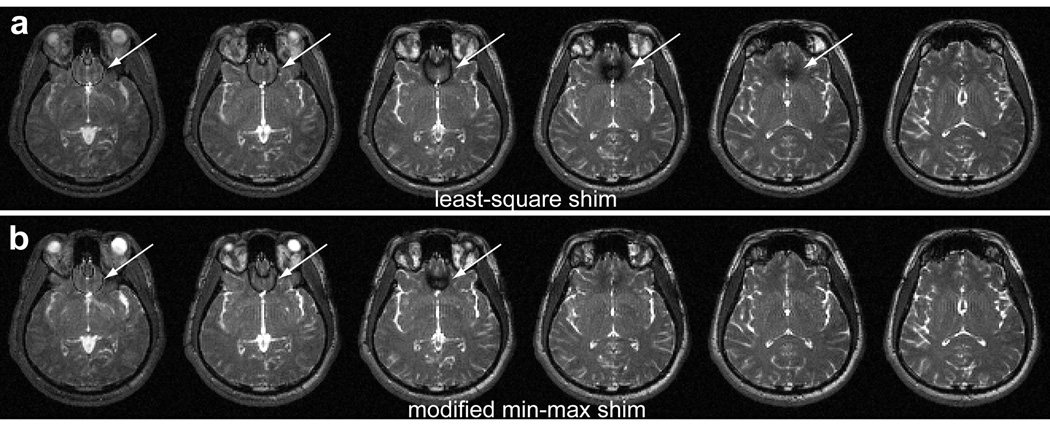
When a lower brain area was scanned with a fixed TR (= 5 ms), the modified min-max shim results provided reduced banding regions compared to those of the least-squares shim (Figure 5). As a result, the method provided more slices without the banding artifact (slice 4 and 5) and reduced banding regions (slice 1, 2 and 3) in the frontal lobe area. When the modified min-max shim method was used, the peak off-resonance frequency was reduced, on average, by 48% compared to that of the least-squares shim results. All the individual results are summarized in Table 1.
Figure 5.
Modified min-max shim result vs least-squares shim result. The least-squares result (a) shows wider banding area (arrows) than the modified min-max shim result (b). Hence, the bSSFP images from the modified min-max shim have more banding free slices (slice 4 and 5 counting from the most inferior slice) and smaller boundary banding regions (slice 1 to 3).
Discussion and Conclusions
In this work, we proposed a new shim method based on the minimization of the maximum absolute off-resonance frequency. The min-max shim algorithm was originally suggested by Prammer et al. (2) but, to the best of our knowledge, has not been popularly used nor demonstrated in vivo in MRI. Moreover, the modification of the min-max shim to adapt to bSSFP imaging has not been proposed. Here, we verified that the min-max shim and the modified version of the method can reduce the peak off-resonance frequency in the brain and can be applicable to bSSFP imaging. The results showed improved spatial coverage with a longer usable TR. The method will be helpful to increase the SNR by allowing a higher readout duty cycle and also to increase the functional contrast in bSSFP fMRI.
To check the stability of the shim methods, the field map measurement that was repeated after configuring the shim parameters was analyzed. In the original min-max shim experiments, both least-squares shim and min-max shim methods showed an excellent convergence within two iterations (most of the cases, without iteration) allowing up to 1 shim step size (0.0015 mT/m) variation in the linear shims and less than 2 Hz change in the center frequency. Consequently, the measurement results matched well with the expected off-resonance frequency range calculated from the field map revealing, on average, 1.38 ± 1.37 Hz difference (the absolute peak off-resonance frequency difference in one side ± standard deviation) in the min-max shim results and 2.42 ± 1.69 Hz difference in the least square shim results. The possible sources of the errors include round-off errors of the finite precision in the shim terms, subject motion, and respiration induced B0 shift (12,24). In the modified min-max shim experiments, slightly larger variability was observed showing a maximum 3 shim step size variation in the linear terms and 3 Hz change in the center frequency. However, the resulting field map still showed small field deviation yielding 4.88 ± 1.64 Hz error in the min-max shim and 2.20 ± 2.75 Hz error in the least-squares shim. Some of the possible sources for the slightly increased instability might be related to the steep off-resonance change near the sinus area which can result in large off-resonance measurement variation due to the aforementioned sources.
When the modified min-max shim method is performed, the mask that encompasses the voxels with excessive off-resonance frequency, which is beyond the 80 % width of 1/TR, is set by the least-squares shim field map. Since certain voxels within this mask are removed by the modified min-max shim method, the resulting field map will have a reduced number of voxels that have excessive off-resonance frequency. Note that not all the voxels whose off-resonance frequency is larger than the pass-band frequency coverage have the banding artifact. However, since the field is continuous, the boundaries of the mask will have close to ±1/(2TR) Hz off-resonance frequency and have the banding artifact. If only a small portion of the voxels within the mask is removed by the modified min-max shim method, then the banding will exists at the boundary of these removed voxels. Hence, the resulting bSSFP image will have reduced boundary banding regions effectively increasing continuously banding free regions as shown in Figure 4. This modified min-max shim method might not provide the optimum solution since some voxels that were excluded in the earlier iteration could be included in the later iteration due to the change of the field distribution. However, the method ensures reduced boundary banding region compared to the least-square shim.
One of the important steps in the min-max shim methods is to define a proper ROI. If a voxel that is located at the outside of the brain region is included in the ROI, it might produce a large variation in the min-max shim result since the frequency measurement of the voxel can significantly change in each field map result. On the other hand, if some of the edge voxels are excluded from the ROI, the resulting bSSFP images might have the banding artifact in those voxels that was the case in our experiments (Figure 3). Therefore, choosing a proper ROI is crucial. The current methods may be improved by acquiring the field map multiple times. Then the voxels with large frequency variation can be avoided by measuring their standard deviation. Since the field map sequence takes only 5 sec for the relatively large area, acquiring it 2 to 3 times is quite practical. The resulting ROI will improve the stability of the results.
One major application of the proposed method can be found in spectroscopy. Fat suppression for spectroscopy is crucial. However, remnant lipid signals are often present due to incomplete suppression originating from the field inhomogeneity. For improved fat suppression, we can modify our technique to ensure that the frequency in lipid regions is outside of the boundary region. Frequency selective pulses will also benefit from our proposed technique. Another possible application is the EPI distortion reduction in fMRI. One might be able to reduce the distortion by limiting the maximum allowable off-resonance range.
Acknowledgment
This work was supported by NIH-R01EB006471, NIH-R21EB002969 and GE Medical Systems.
Reference
- 1.Park HW, Kim YH, Cho ZH. Fast gradient-echo chemical-shift imaging. Magn Reson Med. 1988;7(3):340–345. doi: 10.1002/mrm.1910070311. [DOI] [PubMed] [Google Scholar]
- 2.Prammer MG, Haselgrove JC, Shinnar M, Leigh JS. A new approach to automatic shimming. J Magn Reson. 1988;77(1):40–52. [Google Scholar]
- 3.Schneider E, Glover G. Rapid in vivo proton shimming. Magn Reson Med. 1991;18(2):335–347. doi: 10.1002/mrm.1910180208. [DOI] [PubMed] [Google Scholar]
- 4.Reese TG, Davis TL, Weisskoff RM. Automated shimming at 1.5 T using echo-planar image frequency maps. J Magn Reson Imaging. 1995;5(6):739–745. doi: 10.1002/jmri.1880050621. [DOI] [PubMed] [Google Scholar]
- 5.Webb P, Macovski A. Rapid, fully automatic, arbitrary-volume in vivo shimming. Magn Reson Med. 1991;20(1):113–122. doi: 10.1002/mrm.1910200112. [DOI] [PubMed] [Google Scholar]
- 6.Gruetter R. Automatic, localized in vivo adjustment of all first-and second-order shim coils. Magn Reson Med. 1993;29(6):804–811. doi: 10.1002/mrm.1910290613. [DOI] [PubMed] [Google Scholar]
- 7.Jaffer FA, Wen H, Balaban RS, Wolff SD. A method to improve the B0 homogeneity of the heart in vivo. Magn Reson Med. 1996;36(3):375–383. doi: 10.1002/mrm.1910360308. [DOI] [PubMed] [Google Scholar]
- 8.Shen J, Rycyna RE, Rothman DL. Improvements on an in vivo automatic shimming method [FASTERMAP] Magn Reson Med. 1997;38(5):834–839. doi: 10.1002/mrm.1910380521. [DOI] [PubMed] [Google Scholar]
- 9.Kim DH, Adalsteinsson E, Glover GH, Spielman DM. Regularized higher-order in vivo shimming. Magn Reson Med. 2002;48(4):715–722. doi: 10.1002/mrm.10267. [DOI] [PubMed] [Google Scholar]
- 10.Blamire AM, Rothman DL, Nixon T. Dynamic shim updating: a new approach towards optimized whole brain shimming. Magn Reson Med. 1996;36(1):159–165. doi: 10.1002/mrm.1910360125. [DOI] [PubMed] [Google Scholar]
- 11.Morrell G, Spielman D. Dynamic shim updating (DSU) for multislice magnetic resonance imaging. Magn Reson Med. 1997;38(3):477–483. doi: 10.1002/mrm.1910380316. [DOI] [PubMed] [Google Scholar]
- 12.Lee J, Santos JM, Conolly SM, Miller KL, Hargreaves BA, Pauly JM. Respiration-induced B0 field fluctuation compensation in balanced SSFP: Real-time approach for transition-band SSFP fMRI. Magn Reson Med. 2006;55(5):1197–1201. doi: 10.1002/mrm.20879. [DOI] [PubMed] [Google Scholar]
- 13.van Gelderen P, de Zwart JA, Starewicz P, Hinks RS, Duyn JH. Real-time shimming to compensate for respiration-induced B0 fluctuations. Magn Reson Med. 2007;57(2):362–368. doi: 10.1002/mrm.21136. [DOI] [PubMed] [Google Scholar]
- 14.Wilson JL, Jenkinson M, Jezzard P. Optimization of static field homogeneity in human brain using diamagnetic passive shims. Magn Reson Med. 2002;48(5):906–914. doi: 10.1002/mrm.10298. [DOI] [PubMed] [Google Scholar]
- 15.Hsu JJ, Glover GH. Mitigation of susceptibility-induced signal loss in neuroimaging using localized shim coils. Magn Reson Med. 2005;53(2):243–248. doi: 10.1002/mrm.20365. [DOI] [PubMed] [Google Scholar]
- 16.Oppelt A, Graumann R, Barfuss H, Fischer H, Hartl W, Shajor W. FISP- new fast MRI pulse sequence. Electromedica. 1986;54:15–18. [Google Scholar]
- 17.Bangerter NK, Hargreaves BA, Vasanawala SS, Pauly JM, Gold GE, Nishimura DG. Analysis of multiple-acquisition SSFP. Magn Reson Med. 2004;51(5):1038–1047. doi: 10.1002/mrm.20052. [DOI] [PubMed] [Google Scholar]
- 18.Scheffler K, Seifritz E, Bilecen D, Venkatesan R, Hennig J, Deimling M, Haacke EM. Detection of BOLD changes by means of a frequency-sensitive trueFISP technique: preliminary results. NMR in Biomedicine. 2001;14(7–8):490–496. doi: 10.1002/nbm.726. [DOI] [PubMed] [Google Scholar]
- 19.Miller KL, Hargreaves BA, Lee J, Ress D, Christopher deCharms R, Pauly JM. Functional brain imaging using a blood oxygenation sensitive steady state. Magn Reson Med. 2003;50(4):675–683. doi: 10.1002/mrm.10602. [DOI] [PubMed] [Google Scholar]
- 20.Bowen CV, Menon RS, Gati JS. High field balanced-SSFP fMRI: a BOLD technique with excellent tissue sensitivity and superior large vessel suppression. Miami Beach, USA: 2005. p. 119. [Google Scholar]
- 21.Deshpande VS, Shea SM, Li D. Artifact reduction in true-FISP imaging of the coronary arteries by adjusting imaging frequency. Magn Reson Med. 2003;49(5):803–809. doi: 10.1002/mrm.10442. [DOI] [PubMed] [Google Scholar]
- 22.Schaer M, Kozerke S, Fischer SE, Boesiger P. Cardiac SSFP imaging at 3 Tesla. Magn Reson Med. 2004;51(4):799–806. doi: 10.1002/mrm.20024. [DOI] [PubMed] [Google Scholar]
- 23.Boyd SP, Vandenberghe L. Convex Optimization. Cambridge University Press; 2004. [Google Scholar]
- 24.Noll DC, Schneider W. Respiration artifacts in functional brain imaging: sources of signal variation and compensation strategies. San Francisco, USA: 1994. p. 647. [Google Scholar]


