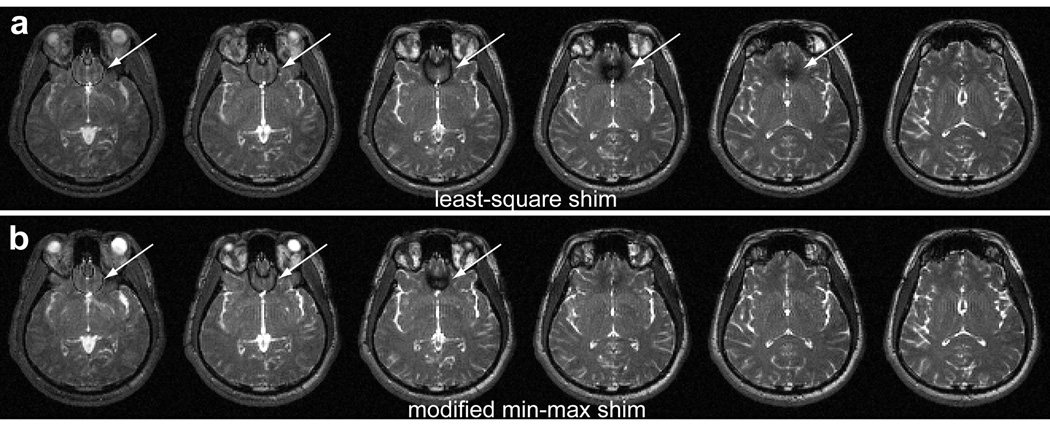
Figure 5.
Modified min-max shim result vs least-squares shim result. The least-squares result (a) shows wider banding area (arrows) than the modified min-max shim result (b). Hence, the bSSFP images from the modified min-max shim have more banding free slices (slice 4 and 5 counting from the most inferior slice) and smaller boundary banding regions (slice 1 to 3).

