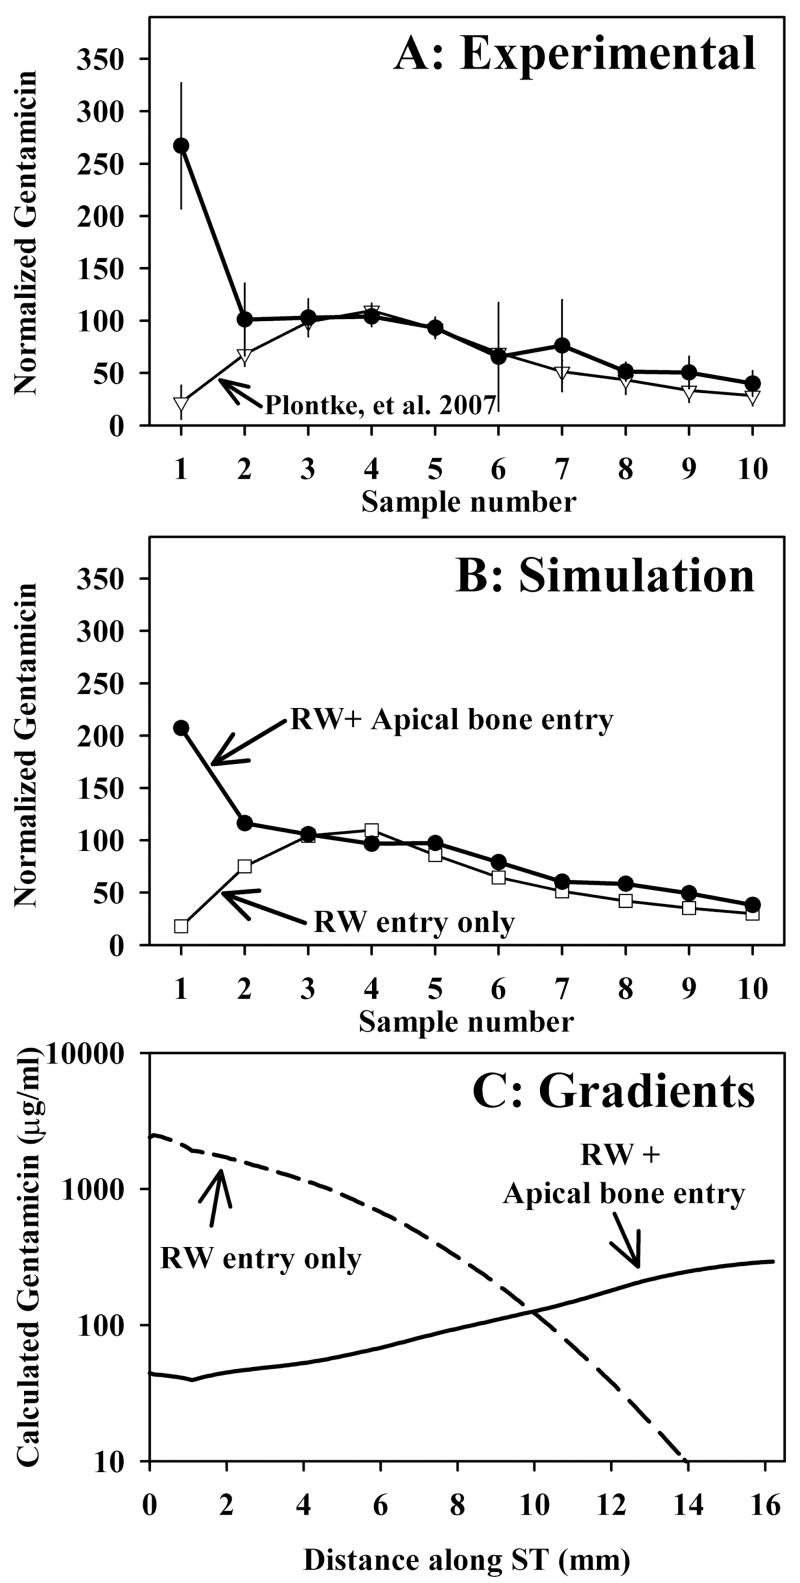
Figure 6.
Perilymph sampling results compared when gentamicin was applied by completely filling the bulla with solution (Panel A: solid symbols, n=4, bars indicate SD) and when gentamicin was applied by irrigating solution across the RWM (Panel A; open symbols, n=9, from Plontke et al. 2007 4). When gentamicin was applied by filling the bulla with solution, the initial samples taken from the apex were high, indicating relatively higher concentrations in the apical perilymph. Sample concentrations from each experiment were normalized, setting the average of samples 3, 4 and 5 to 100.
Panel B: Computer simulations of the sampling experiments from Panel A. Open symbols show simulations in which gentamicin enters only through the RWM, with parameters adjusted to fit the data from experiments in which gentamicin was applied by irrigation across the RWM. The curve with closed symbols in Panel B was calculated with identical parameters but includes an additional communication between the middle ear and perilymph (representing entry through the bone) for apical perilymph locations. Panel C: Gentamicin concentration gradients along scala tympani prior to sampling derived from the computer simulation of experiments. The two curves show the calculated distribution of gentamicin along the cochlea that accounts for the sample concentrations observed under each protocol.

