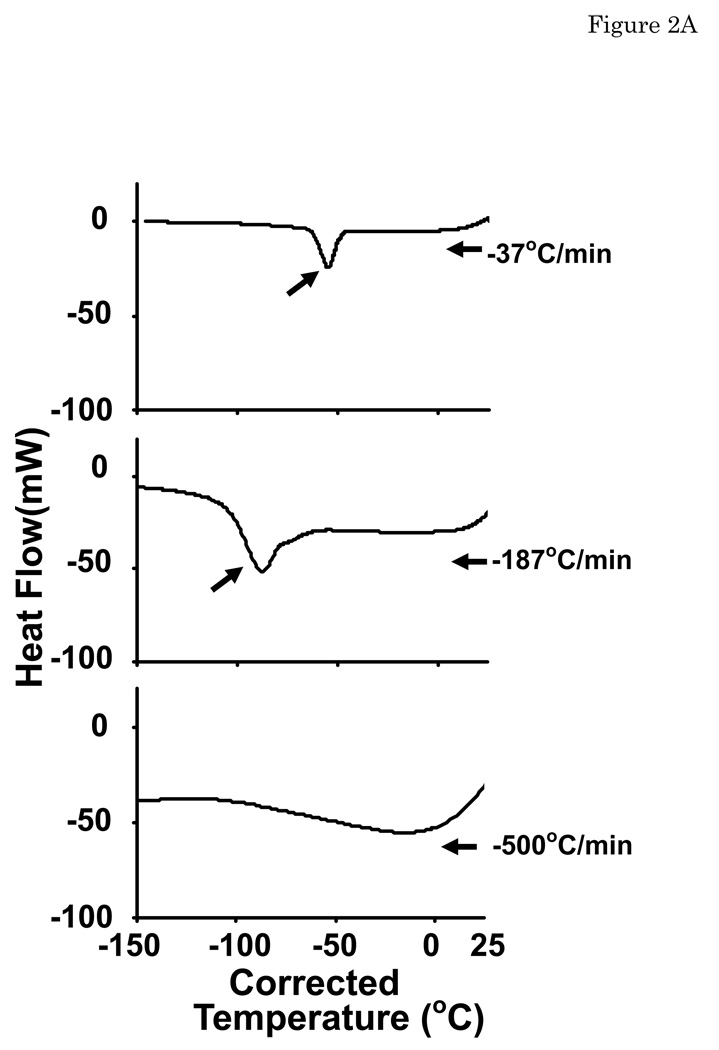
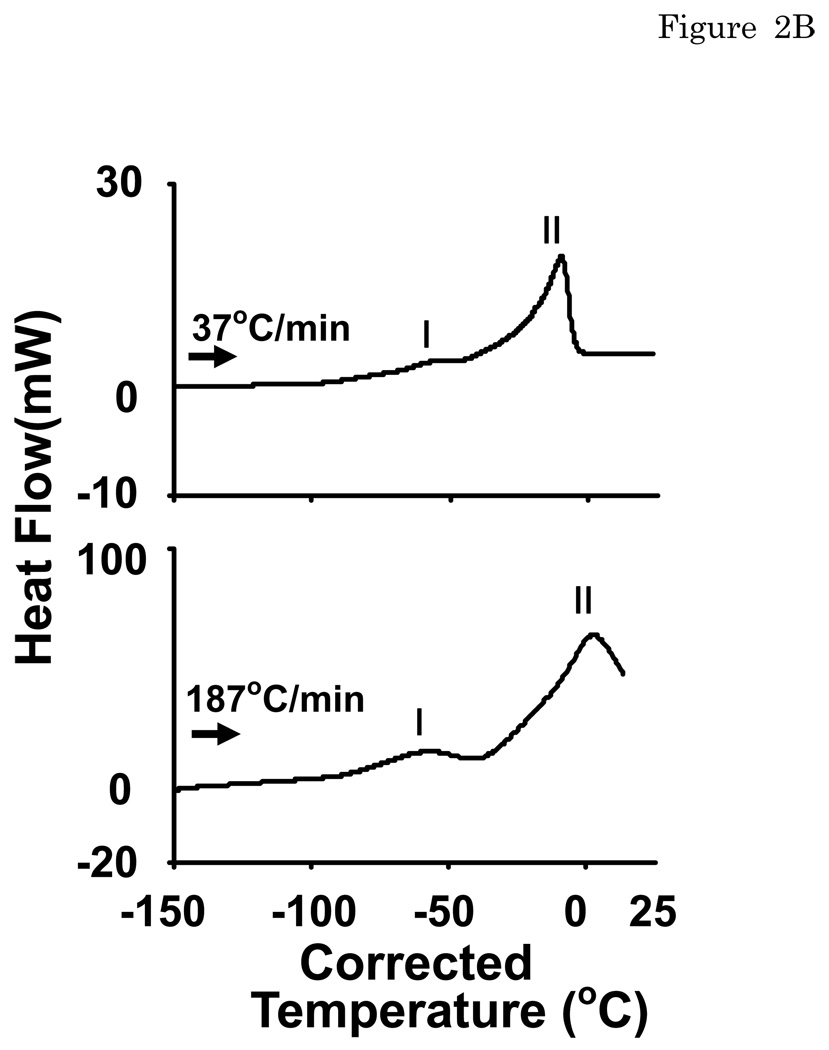
Fig. 2.
DSC thermograms of a drop of EAFS 10/10 (A) cooled at 37, 187, 500 °C/min and (B) warmed at the same rate they were cooled. A downward peak is exothermic. The arrows indicate whether the thermogram involved cooling or warming. The temperatures on the abscissa have been corrected for the instrument and thermal lags induced by cooling and warming rates greater than the initial calibration– see Methods and [25].


