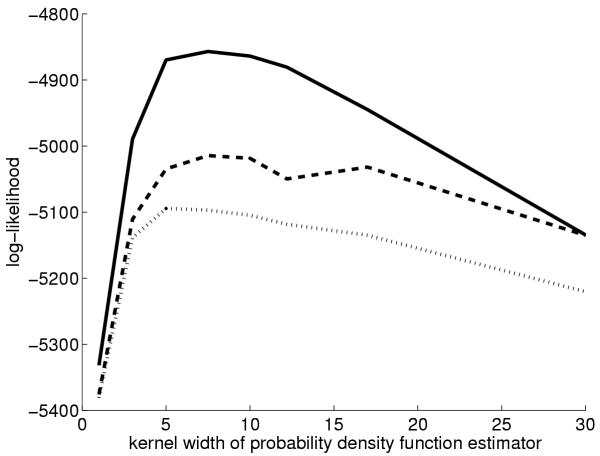
Figure 6.
Accuracy of SOMs of human gene expression data in representing expression of homologous mouse genes. Technically, the goodness measure is the log-likelihood of the estimator of the conditional probability density of the classes at the closest SOM unit for each data point. The horizontal axis is the "smoothness" of the density estimator. Dashed line: SOM in learning metrics, dotted line: SOM in inner product metrics, solid line: the approximate upper limit, i.e. the estimate computed at the data point instead of at the SOM unit.

