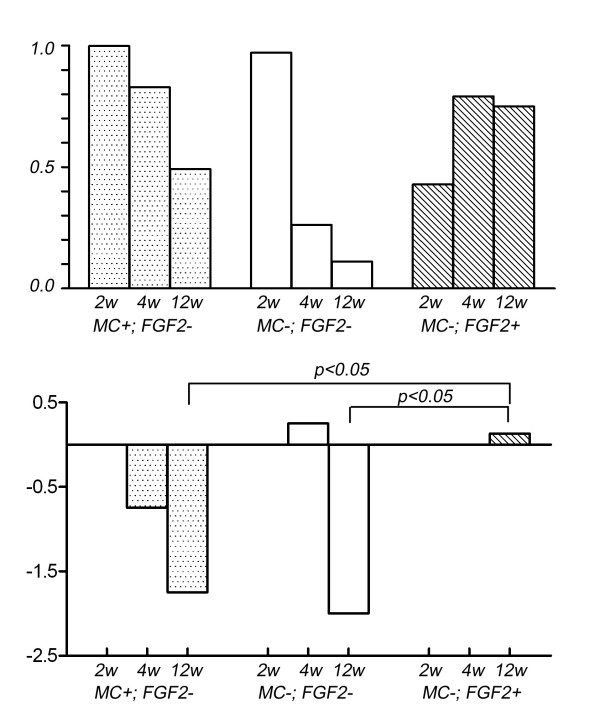
Figure 2.
The size of the bone formation of the host bone was also quantitatively measured in the lateral view. The area was calculated in relation with that in the (MC-; FGF2-) group at 2 weeks in ratio (top). The status of the grafted bone is scaled and the average is given. The scale is as follows: severe bone absorption (-2), mild bone absorption (-1), no change (0), single nodules of bone formation (1) and bridging or lamellar bone formation (2) (bottom).

