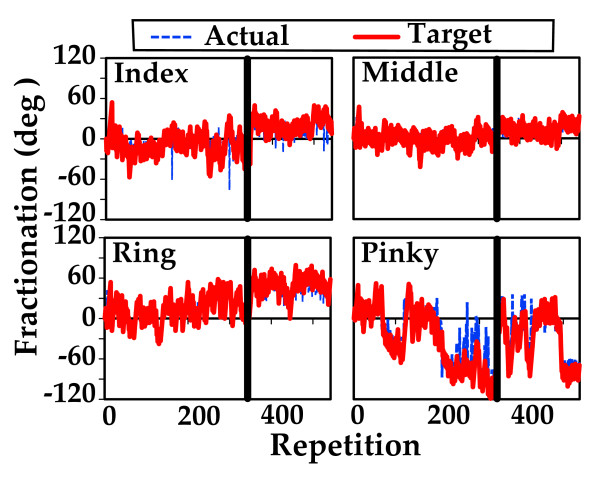
Figure 6.
Target and actual fractionation changes during training in subject S5. The solid line depicts target fractionation and the dashed line depicts actual fractionation changes over two weeks of training for each of the four fingers for subject S5. The vertical line separates training with Algorithm A on the left and Algorithm B on the right (see Fig. 3). Minimal changes in fractionation were accomplished by this subject.

