Fig. 5.
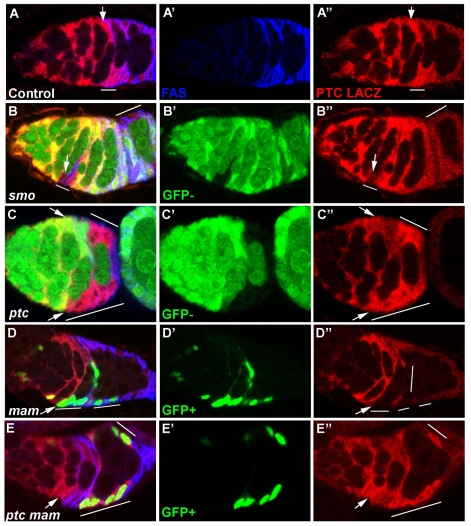
Elevated Hh pathway activity in FSCs depends on Mam. (A-A″) Control germarium stained with FasIII (A′, blue) and β-gal (A″, red) to show ptc-lacZ expression (posterior to the right). FSCs are recognized as being immediately anterior to follicle cells with strong FasIII staining. Higher levels of ptc-lacZ are seen in the FSC (arrow) or the FSC and its immediate progeny (line) than in more posterior FSC derivatives. (B,C) Mutant clones are marked by loss of GFP (green). (B-B″) Reduced levels of ptc-lacZ (B″, red) are seen in a smo2 mutant FSC and its immediate progeny (line, arrow marks FSC). Lower ptc-lacZ levels at th posterior of the germarium and in budded egg chambers are not altered in smo mutant cells (B, line). (C-C″) Loss of ptc (lines, bottom arrow indicates a FSC within a ptc mutant clone) results in higher levels of ptc-lacZ (red, C″) than seen in a wild-type FSC (top arrow). (D,E) Mutant clones are marked by GFP (green) expression. (D-D″) Reduced levels of ptc-lacZ (red, D″) are seen in a mam mutant FSC and its recent progeny (lines, arrow marks the FSC). (E-E″) ptc mam double mutant clones (lines) show similar levels of ptc-lacZ (red, E″) expression to the wild-type FSC (arrow) within the same germarium.

