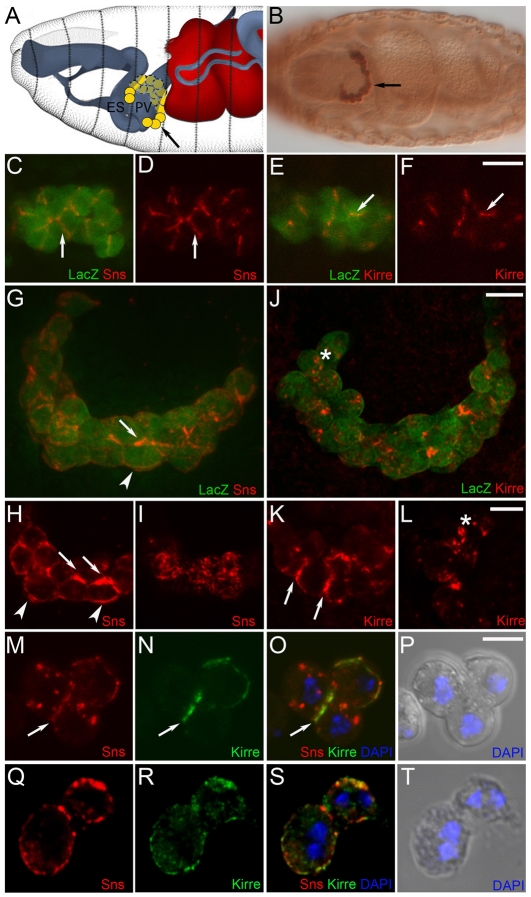
Fig. 1.
Expression of Sns and Kirre in embryonic GCNs. (A) Schematic, modified with permission from Hartenstein (Hartenstein, 1993) to indicate the position of GCNs (yellow) at embryonic stage 16. (B-L) GCNs were identified by expression of the sns-GCN-lacZ transgene. (B) Ventral view, stage 16. (C-F) Confocal single section of GCNs at stage 13. Sns (red) and Kirre (red) are present at cell-cell contacts (arrows). Arrow in B indicates GCNs marked by β-galactosidase. (G-L) Ventral views, stage 16. Projections of confocal sections (∼20 μM) (G,J) and single sections (H,I,K,L) reveal Sns (H,I) and Kirre (K,L) on the cell surface (arrowheads), cell-cell contacts (arrows) and in intracellular and cell surface puncta (asterisks). Note the uneven pattern of Sns on the cell surface in (I). (M-T) FACS-isolated nGFP-positive cells from sns-GCN-nGFP transgenic embryos. Single confocal sections show partial co-localization of Sns and Kirre on the surface of mononucleate (9-12 hours AEL) (M-P) and binucleate (12-18 hours AEL) (Q-S) GCNs. Scale bars: 10 μm in C-L; 5 μm in M-T. ES, esophagus; PV, proventriculus.

