Fig. 5.
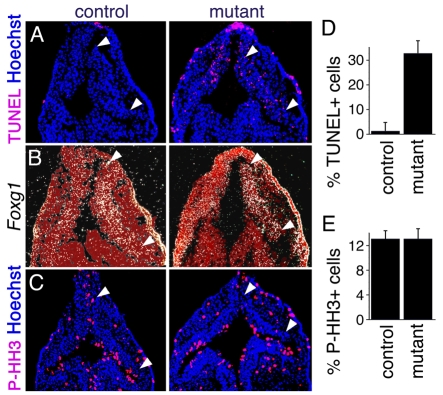
Without Fgfr expression, Foxg1-expressing cells die.(A-C) Serial horizontal sections from 16-somite stage control (left) and mutant (right) embryos (anterior up). The areas between the arrowheads are the Foxg1-expressing telencephalic precursors, as determined by in situ hybridization (B). (D) Few TUNEL+ cells (A, purple) are detected in the Foxg1 domain of the control, whereas in mutants ∼30% of cells are labeled. (E) The number of P-HH3+ (C, purple) mitotic cells, however, is similar in both controls and mutants. Hoechst-labeled DNA is blue.

