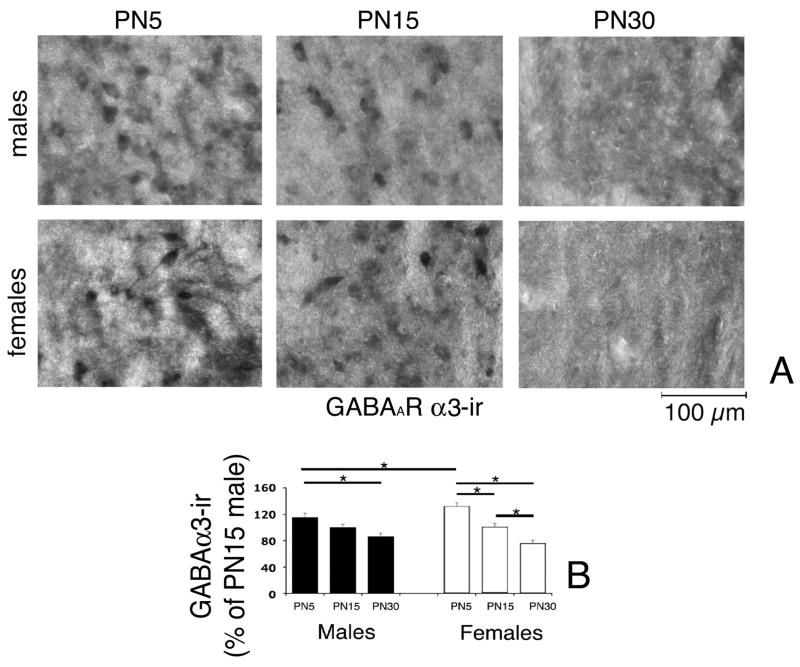
Fig. 9.
Expression of GABAAR α3-ir in the anterior SNR of PN5, PN15, and PN30 male and female rats.
Panel A: Representative photographs of anterior SNR neurons stained with anti-GABAARs α3 specific antibody. The α3-ir decreases with age. The scale bar indicates 100μm distance.
Panels B: Densitometric comparisons of perisomatic α3-ir confirmed the developmental decrease in GABAARs α3-ir in both male and female rats between PN5 and PN30. Densitometry was done on individual α3-ir anterior SNR cells and was averaged for each brain. At PN5, females expressed more GABAARs α3-ir than males. The asterisks indicate statistically significant differences (P<0.05) between the groups linked with bars.

