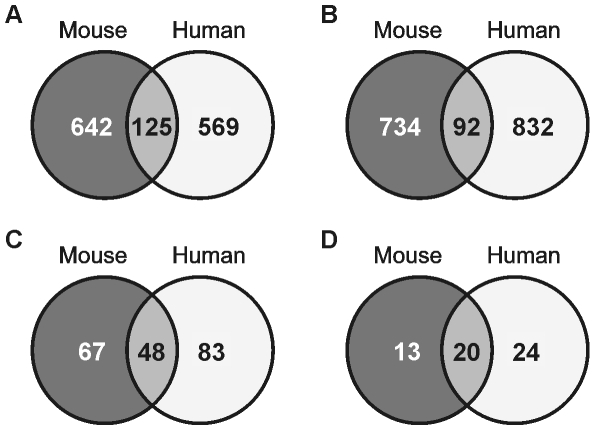
Figure 3. Limited overlap at individual gene level but major overlap at pathway level.
Venn diagrams showing overlap in significantly upregulated (A) and (B) downregulated genes after treatment with Wy14643 in mouse versus human hepatocytes. Genes were included if they were significantly regulated by Wy14643 at 6 h and/or 24 h. Criteria for significance was mean fold-change (MFC)>1.1 and P<0.05. Genes without orthologs in the other species and/or not present on the array of the other species were excluded. (C) Venn diagram showing overlap in overrepresented Gene Ontology classes upon Wy14643 treatment in mouse and human hepatocytes based on a functional class score method. Data from 6 h and 24 h Wy14643 treatment were combined in a single analysis. Only GO classes containing 8 to 125 genes and FDR<0.0001 were included in the Venn diagram. (D) Venn diagram showing overlap in upregulated processes analyzed by GSEA. Only gene sets having a size between 15 and 250 genes were included in the analysis. To account for multiple hypothesis tasting, gene sets having a FDR<0.25 were selected. Sources of the gene sets: BIOCARTA, GENMAPP, KEGG, SIGNALING ALLIANCE, SIGNALING TRANSDUCTION, GEARRAY and SK manual.

